A2/AS Economics OCR
- Created by: JadeLA
- Created on: 28-05-17 19:59
Economies of Scale
In microeconomics, economies of scale are the cost advantages that enterprises obtain due to size, output, orscale of operation, with cost per unit of output generally decreasing with increasing scale as fixed costs are spread out over more units of output. Economies of scale: financial risk bearing purchasing (accept bulk buying for identification) technical marketing managerial
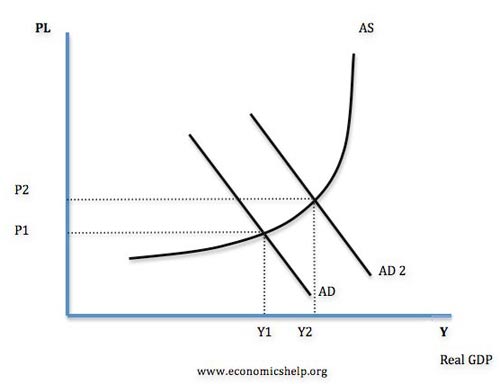
Fiscal Policy: Expansionary
- This involves increasing AD.
- Therefore the government will increase spending (G) and / or cut taxes (T). Lower taxes will increase consumers spending because they have more disposable income (C)
- This will tend worsen the government budget deficit and the government will need to increase borrowing.
Diagram showing effect of expansionary fiscal policy
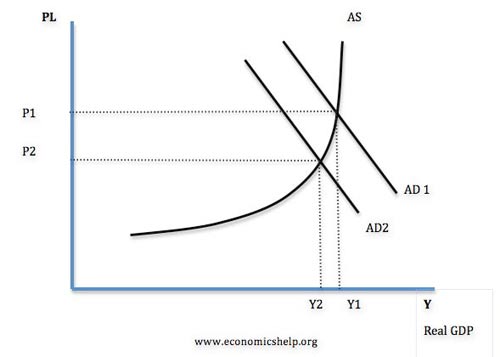
Fiscal Policy: Deflationary
- This involves decreasing AD.
- Therefore the government will cut government spending (G) and / or increase taxes. Higher taxes will reduce consumer spending (C)
- Tight fiscal policy will tend to cause an improvement in the government budget deficit.
Diagram showing the effect of tight fiscal policy
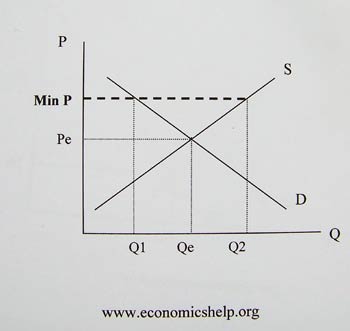
Minimum price Diagram
A minimum price will lead to a surplus (Q2 – Q1) to overcome this the govt could
- 1. Buy the surplus and store it
- 2. Increase Demand through advertising
- 3. Reduce Supply through quotas
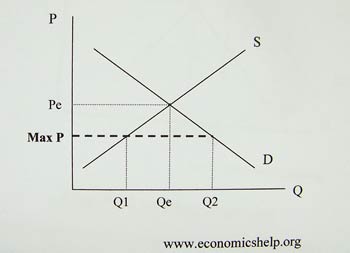
Maximum price diagram
Maximum Price: This involves putting a limit on any increase in price
The Maximum price will be above the equilibrium.
- However the problem of a maximum price is that there will be a shortage Demand is greater that supply.(Q2-Q1)
- This will encourage the operation of black markets.
Therefore the government will have to ration the goods or increase supply
Buffer stock
Buffer stock: scheme is a government plan to stabilise prices in volatile markets. This requires intervention buying and selling.
Buffer stock schemes aim to:
- Stabilise prices
- Ensure supply of food
- Prevent farmers / producers going out of business because of drop in prices.
If there is a surplus one year, the market price would fall. If supply increases to S2, price falls to P1. This is when the government will buy the surplus stocks (Q2-Q1) and store the goods. This reduces supply and keep prices at the target price. If there is a shortage in the next year, the government can sell from its buffer stock to reduce prices and increase market supply.

Inflation and Deflation
Inflation and deflation arise from changes in either the demand side or supply side of the macro-economy.
Demand pull inflation
Demand pull inflation usually occurs when there is an increase in aggregate monetary demand caused by an increase in one or more of the components of aggregate demand (AD), but where aggregate supply (AS) is slow to adjust.
Inflation: Cost push
Cost-push inflation occurs when an economy experiences a negative cost shock.
An increase in costs causes the aggregate supply curve to shift upward and to the left, resulting in a rise in the price level, and a contraction of aggregate demand.
Deflation: causes
Deflation tends to occur when the economy’s capacity, as indicated by the position of the AS curve, grows at a faster rate than AD. Firms have to cut prices in order to stimulate sales and get rid of stocks.
Deflation can be triggered by an increase in supply. As business and consumer confidence in the economy declines, AD falls, resulting in recession.
Monopoly: Key characteristics
-
Monopolies can maintain super-normal profits in the long run. Profits are maximised when MC = MR. The level of profit depends upon the degree of competition in the market, which for a pure monopoly is zero. At profit maximisation, MC = MR, and output is Q and price P. Given that price (AR) is above ATC at Q, supernormal profits are possible (area PABC).
-
With no close substitutes, the monopolist can derive super-normal profits, area PABC.
-
A monopolist with no substitutes would be able to derive the greatest monopoly power.
Natural Monopolies: Avoiding wasteful duplication
The best way to ensure competition, avoiding duplication, is to allow new train operators to use the existing track; hence, competition has been introduced, without duplication of costs. This is called opening-up the infrastructure. This approach is frequently adopted to deal with the problem of privatising natural monopolies and encouraging more competition, such as:
-
Telecoms, the network is provided by BT
-
Gas, the network is provided by National Grid (previously Transco)
With a natural monopoly, ATC keep falling because of continuous economies of scale. In this case, MC is always below ATC over the whole range of possible output.
Natural Monopolies: Profit
In order to maximise profits the natural monopolist would charge Q, and make super-normal profits. If unregulated, and privately owned, the profits are likely to be excessive. In addition, the natural monopolist is likely to be allocatively and productively inefficient.
Oligopoly: Competitive
Oligopolists prefer non-price competition in order to avoid price wars.
Oligopolies may pursue the following pricing strategies:
-
Predatory pricing to force rivals out of the market. This means keeping price artificially low, and often below the full cost of production.
-
They may also operate a limit-pricing strategy to deter entrants.
-
Oligopolists may collude with rivals and raise price together.
-
Cost-plus pricing is a straightforward pricing method, where a firm sets a price by calculating average production costs and then adding a fixed mark-up to achieve a desired profit level.
Oligopoly: Kinked demand curve
The reaction of rivals to a price change depends on whether price is raised or lowered. The elasticity of demand, & the gradient of the demand curve, will be different. The demand curve will be kinked, at the current price.
Even when there is a large rise in marginal cost, price tends to stick close to its original, given the high price elasticity of demand for any price rise.
At price P, and output Q, revenue will be maximised.
Oligopoly: Disadvantages
· High concentration reduces consumer choice.
· Cartel-like behaviour reduces competition and can lead to higher prices and reduced output.
· Given the lack of competition, oligopolists may be free to engage in the manipulation of consumer decision making.
· Firms can be prevented from entering a market because of deliberate barriers to entry.
· There is a potential loss of economic welfare.
· Oligopolists may be allocatively and productively inefficient. At profit maximising equilibrium, P, price is above MC, and output, Q, is less than the productively efficient output, Q1, at point A.
Oligopoly: Disadvantages diagram
Monopolistic competition
Equilibrium under monopolistic competition: In the short run supernormal profits are possible, but in the long run new firms are attracted into the industry, because of low barriers to entry, good knowledge and an opportunity to differentiate.
Monopolistic competition in the short run: At profit maximisation, MC=MR, and output is Q and price P. Given that price (AR) is above ATC at Q, supernormal profits are possible (area PABC). As new firms enter the market, demand for the existing firm’s products becomes more elastic and the demand curve shifts to the left, driving down price. Eventually, all super-normal profits are eroded away.
Monopolistic competition: Long Run
Super-normal profits attract in new entrants, which shifts the demand curve for existing firm to the left. New entrants continue until only normal profit is available. At this point, firms have reached their long run equilibrium.
Clearly, the firm benefits most when it is in its short run and will try to stay in the short run by innovating, and further product differentiation.
Monopolistic competition: Inefficiencies
The firm is allocatively and productively inefficient in both the long and short run.
There is a tendency for excess capacity because firms can never fully exploit their fixed factors because mass production is difficult. This means they are productively inefficient in both the long and short run. However, this is may be outweighed by the advantages of diversity and choice. As an economic model of competition, monopolistic competition is more realistic than perfect competition.
Perfect Competition: The firm as a price taker
The single firm takes its price from the industry, and is, consequently, referred to as a price taker. The industry is composed of all firms in the industry and the market price is where market demand is equal to market supply. Each single firm must charge this price and cannot diverge from it.
Perfect Competition: Equilibrium
In the short run: firms can make super-normal profits or losses.
Perfect Competition: Long Run
Firms are attracted into the industry if the incumbent firms are making supernormal profits. This is because there are no barriers to entry and because there is perfect knowledge. The effect of this entry into the industry is to shift the industry supply curve to the right, which drives down price until the point where all super-normal profits are exhausted. If firms are making losses, they will leave the market as there are no exit barriers, and this will shift the industry supply to the left, which raises price and enables those left in the market to derive normal profits.
In the long run: The super-normal profit derived by the firm in the short run acts as an incentive for new firms to enter the market, which increases industry supply and market price falls for all firms until only normal profit is made.
Perfect Competition
Consumer surplus
Consumer surplus is derived whenever the price a consumer actually pays is less than they are prepared to pay.
Producer surplus
Producer surplus is the additional private benefit to producers, in terms of profit, gained when the price they receive in the market is more than the minimum they would be prepared to supply for.
Economic Welfare
Economic welfare is the total benefit available to society from an economic transaction or situation.
Productive efficiency
Productive efficiency is concerned with producing goods and services with the optimal combination of inputs to produce maximum output for the minimum cost. // To be productively efficient means the economy must be producing on its production possibility frontier
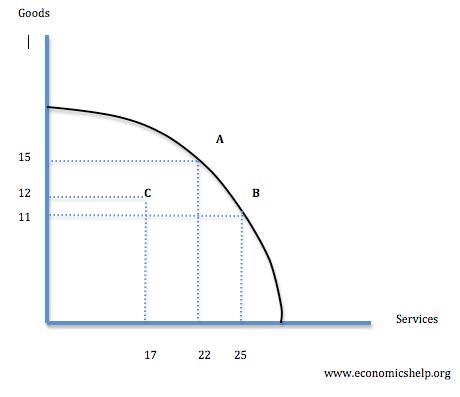
- Points A and B are productively efficient.
- Point C is inefficient because you could produce more goods or services with no opportunity cost
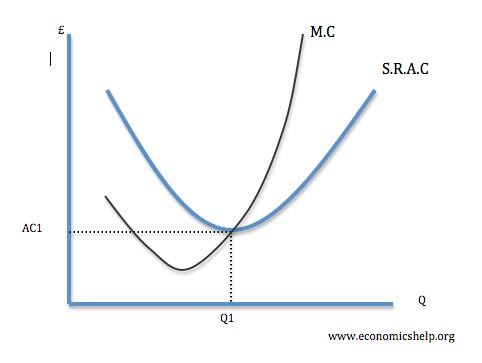
Productive efficiency
A firm is said to be productively efficient when it is producing at the lowest point on the average cost curve (where Marginal cost meets average cost).
A firm is technically efficient when it combines the optimal combination of labour and capital to produce a good. An economy can be productively efficient but have very poor allocative efficiency.
Allocative efficiency is concerned with the optimal distribution of resources.
Comments
No comments have yet been made