Break-even analysis

?

38.1 Introduction

Break-even analysis compares a firm's revenue with its fixed and variable costs to identify the maximum level of sales needed to cover costs. This can be shown on a graph knwon as a break-even chart. 

Businesses need to know how many products they have to produce to sell and in order to cover all their costs. This is particularly important for new businesses with limited experience of their markets.

To calculate the break-even point we need information on both costs and prices. Break-even can be shown on a graph or calculated. 

1 of 12

38.2 Calculating break even

Calculating the break-even point for a product requires knowledge of:

  • the selling price of the product
  • its fixed costs
  • its variable costs per unit.

The break-even output level can be calculated by the following formula:

BE output = fixed costs/(selling price per unit - variable cost per unit)

2 of 12

38.3 Contribution

In the formula for BE, price minus variable costs is known as contribution. It is the surplus between the selling price and the variable costs per unit. 

Contribution per unit = selling price - variable costs per unit.

Total contribution = contribution per unit x quantity sold. 

Total contribution is a useful short-cut way to work out profit as :

  • Total contribution - fixed costs = profit. 
3 of 12

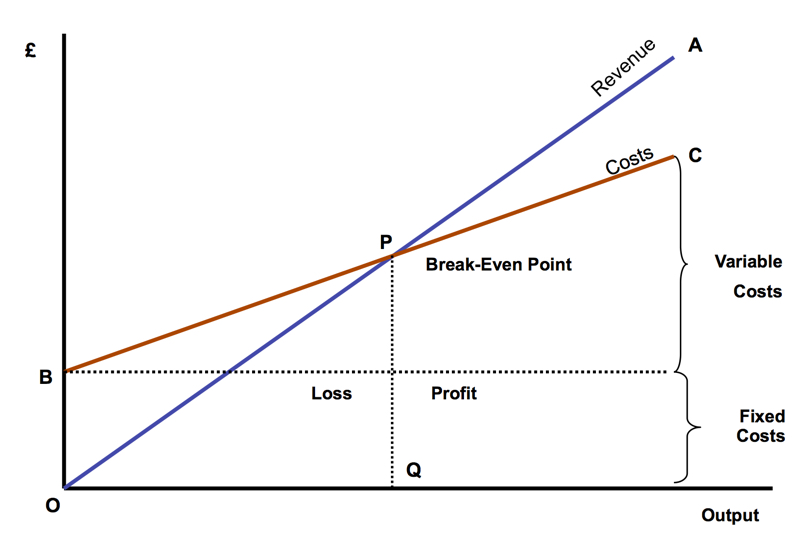
38.4 Break-even charts

A break even chart is a graph showing the revenue and costs for a business at all possible levels of demand or output. The break-even chart uses the horizontal axis to represent the output per time period for the business, for example, beteen 0 and 1000 units a month. The vertical axis represents costs and sales in £.

Margin of safety = sales - BE point.

The higher the MoS the less likely it is that a loss-making strategy situation will develop. 

4 of 12

38.5 Using break-even charts

Internal factors in businesses affecting the BE chart:

  • Extra launch advertising - Fixed costs rise, so total costs rise and the BE point rises. 
  • Planned price increase - Revenue rises more steeply; BE point falls.
  • Using more machinery (and less labour) in production - Fixed costs rise while variable costs fall; uncertain effect on BE point. 

External factors in businesses affecting the BE chart:

  • Fall in demand - BE point is not affected, though the margin of safety is reduced.
  • Competitors' actions force price cut - Revenue rises less steeply; BE point rises.
  • Fuel costs rise - Variable and total cost lines rise more steeply; BE point rises. 
5 of 12

38.6 The effects of changes in price, output and c

On its own, a limitation of the BE chart is that it's a static model. It doesn't show sales trends over time. Fortunately it can be a useful method for showing when changes are planned, for example, when the business is considering a price increase.

The main changes to consider are:

  • The impact on revenue, profits and BE of a change in price.
  • The impact on revenue and profits of a change in demand, perhaps because the product has become more or less fashionable. 
  • The effect of a rise or fall in variable costs such as raw materials.
  • The effect of a rise or fall in fixed costs, perhaps when a business chooses to 'downsize' to smaller, cheaper head office premises. 
6 of 12

Price rise

If a company increases its prices, its revenue line will rise more steeply than before. The line will start at the same point as before but will rise to a higher revenue point at maximum output. This steepening of the revenue line will increase the profit potential at each level of output and lower the BE point. So if you charge more, you don't need to sell as many to BE.

7 of 12

A rise or fall in demand

A change in demand has no effect on the lines of the BE chart. It is simply that you have to read the change off the chart by drawing a line vertically up from the new sales quantity. 

8 of 12

Rise in variable costs

A variable cost rise would make the variable cost line rise more steeply, though it would start from the same point (zero). Naturally, if the variable costs rise, the total costs must also be affected. So, if asked to show the effect on a BE chart of a rise in variable costs, the total cost line must also be adjusted. 

9 of 12

Fall in fixed costs

If a company's sales are falling it may be necessary to cut fixed costs in order to lower the BE point. The fall in fixed costs will cut the total costs line. 

10 of 12

38.7 The value of break-even analysis

Strengths

BE analysis is simple to understand. It's particularly useful for small and newly established businesses, where the managers may not be able to employ more sophisticated techniques. Businesses can use BE to:

  • estimate the future level of output they will need to produce and sell in order to meet given profit objectives
  • assess the impact of planned price changes upon profit and the level of output needed to BE
  • take decisions about whether to produce their own products or components or whether to purchase from external sources. 
11 of 12

38.7 The value of break-even analysis

Weaknesses

The weaknesses of BE analysis are set out below:

  • The model is a simplification. It assumes that variable costs increase constantly, which ignores the benefits of bulk buying. If a firm negotiates lower prices for purchasing larger quantities of raw materials then its total cost line will no longer be straight.
  • Similarly, BE analysis assumes the firm sells all its output at a single peak. In reality, firms frequently offer discounts for bulk purchases.
  • A major flaw in the technique is that it assumes that all output is sold. In times of low demand, a firm may have difficulty in selling all that it produces. 
12 of 12

Comments

No comments have yet been made

Similar Business Studies resources:

See all Business Studies resources »See all Decision-making to improve financial performance resources »