Micro Topic 1c Production possibility curves
- Created by: Itwasntme193
- Created on: 15-10-20 16:22
Fullscreen
Definition: The PPC shows how much can be produced using all possible resources in the economy.
Assumptions when drawing a PPB:
- 2 goods are being produced
- current factors of production
- productivity= output per f.op per hour
- technology is fixed (c.p)
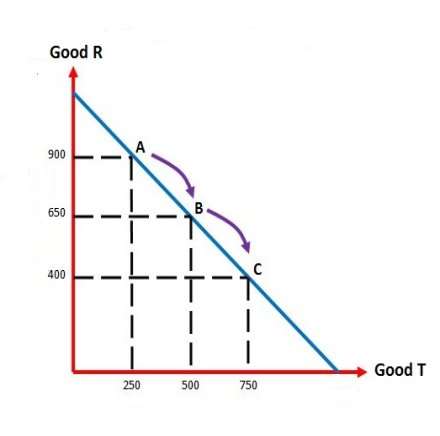
STRAIGHT LINE=Constant opportunity cost (what you give up is equal to what you gain on any point of the curve).
CURVED LINE= The f.o.p are not equally suited to produce each output. As output of one good/service is increased, more resources have to be sacrificed for production. Opportunity cost increases.

- If a point lies within a PPF, then resources are being employed inefficiently. Total output…
Comments
No comments have yet been made