

7 Compulsory practicals 2016 - Biology HL
- Created by: IBonfire
- Created on: 17-04-16 09:26
Core Practicals Biology
Practical 1 – Topic 1.1 pg25
Use of a light microscope to investigate the structure of cells and tissues, with drawing of cells. Calculation of the magnification of drawings and the actual size of structures and ultrastructures shown in drawings of micrographs.
Equations
magnification of a microscope = mag. eyepiece lens x mag. objective lens
actual size = (length of image/length of scale bar)*value scale bar represents
magnification = size of image / actual size of specimen
magnification using scale bar = size of scale bar / what scale bar represents
1cm = 10mm = 10,000 um
Be sure to use the same units.
How to calibrate an eyepiece graticule
When carrying out calibration, each objective lens has to be separately calibrated. This will result in separate calibration factors for each objective.
Start with the lowest power objective on the microscope. The scale on the stage micrometer is aligned with the scale of the eyepiece graticule and then a reading is taken from the scales. These readings are then used to calculate the calibration factor for the objective lens in use. The following example shows how to calibrate the graticule for the x40 objective lens:
-
Reading from the two scales we find 100 divisions on the eyepiece graticule equals 25.9 divisions on the stage micrometer.
-
For the particular stage micrometer we are using 100 divisions = 1mm (this information is marked on the stage micrometer).
Each division is 1/100 mm = 10µm
-
100 eyepiece div = 25.9*10 µm
-
1 eyepiece div = 259/100 µm =2.59 µm
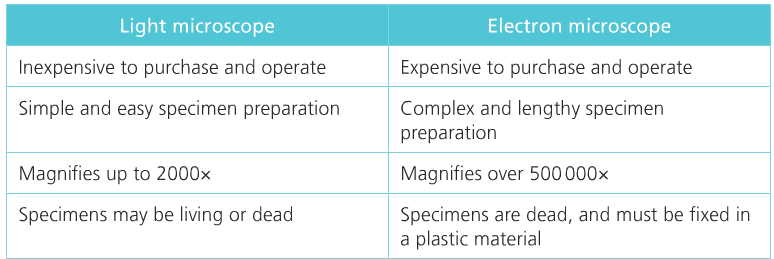
Light microscopes vs. Electron Microscopes
Cell Diagrams
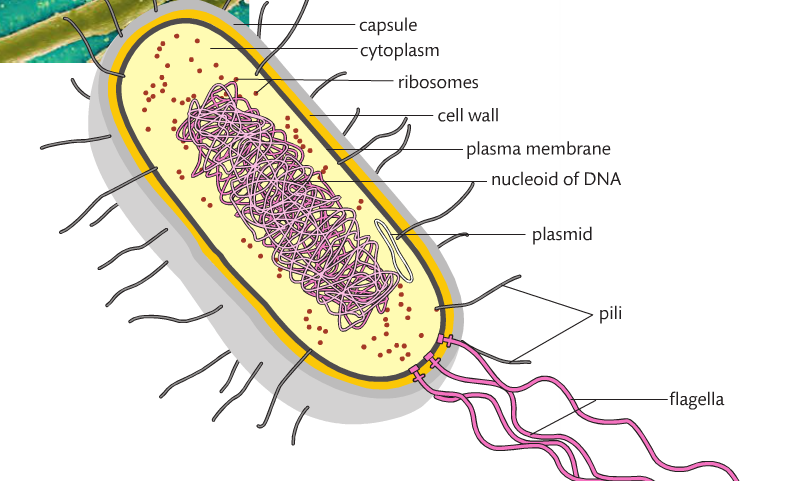
Prokaryotes
9 key structures
Nucleoid Region
Plasmid
Cell Wall
Plasma Membrane
Ribosomes
Cytoplasm
Flagellum
Pili
Gel Capsule
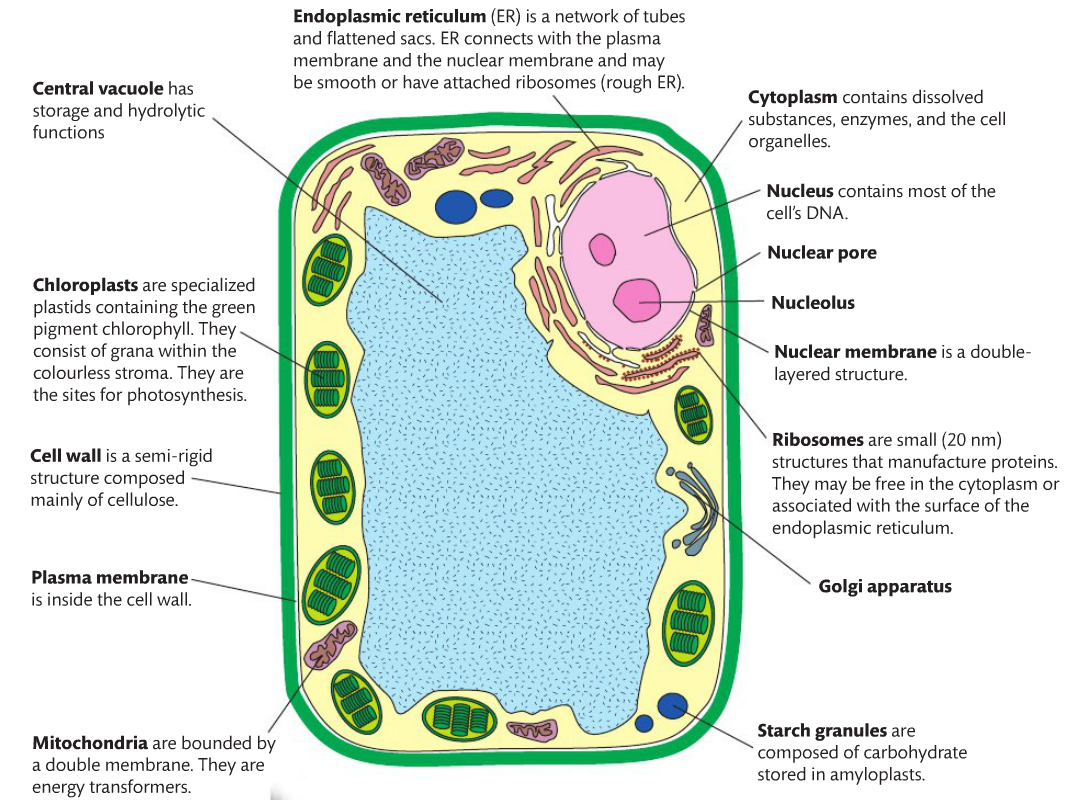
Eukaryotes
14 key structures for animal cells and 15 key structures for plant cells
Nucleus
Nucleolus
Nuclear Membrane
Nuclear Pore
Smooth Endoplasmic Reticulum
Rough Endoplasmic Reticulum
Golgi Apparatus
Lysosomes
Vacuole
Centrioles
Ribosomes
Chloroplasts
Mitochondria
Plasma Membrane
Cytoplasm
Cell Wall
Starch Granules

Practical 2 – Topic 1.4
Aim: Estimation of osmolarity in tissues by bathing samples in hypotonic and hypertonic solutions.
Dependent variable: Volume of each core using fluid displacement, mass of each potato core using top pan balance
Independent variable: Sucrose molarity, measured in M, such as 0.0M, 0.2M, 0.4M, 0.6M, 0.8M, 1.0M
Osmolarity: The concentration of a solution expressed as the total number of solute particles per litre
Hypotonic: Having a lower osmotic pressure in a fluid relative to another fluid. A hypotonic solution has a lower osmotic pressure (or less solutes) than another solution.
Hypertonic: Having a higher osmotic pressure in a fluid relative to another fluid. A hypertonic solution has a higher osmotic pressure (or more solutes) than another solution.
Equipment:
-
Cork borer
-
Six different sucrose molarities (0.0M, 0.2M, 0.4M, 0.6M, 0.8M and 1M)
-
Top pan balance
-
Graduated cylinder (for fluid displacement)
-
Potato
-
Test tubes
-
Scalpel
Method:
-
With a cork borer, cut six cores from a potato. The cores should all be as close to the same length as possible 30-50mm cores…
Comments
No comments have yet been made