Price Determination in a Competitive Market
- Created by: ekenny5
- Created on: 01-12-20 17:39
Demand
Demand for a good or service is the quantity that purchasers are willing and able to buy at a given price level in a given period of time. Effective demand is demand backed up by a willingness and ability to pay the market price.
The Law of Demand is that demand is inversley proportional to price. increased price decreases demand. Lower prices make products more affordble for consumers so demand increases.
The ruling market price is the price at which supply = demand, the equilibrium. This is guided by the invisible hand - consumers go to the product with the lowest price or best quality.
Highly competitive markets lack entry and exit barriers - suppliers can easily enter and leave the market without incurring costs. More competition often means lower prices, as firms have to be competitive to win consumer's business. This would cause demand to rise in this market
The Demand Curve
P1 Q1 is the equilibrium (ruling market price)
When price increases to p2, demand contracts (Q2)
When price decreases to P3, demand expands (Q3) - lower price increases demand as more affordable
Effects on Demand
Income effects:
- a fall in price of a good or service increases the real purchasing power of the consumers (more can be bought with the same amount)
- for normal goods, goods demanded rises with an increase in real income
- for inferior goods, a rise in real income decreases demand
- opposites for fall in real income
Substitute effects:
- a fall in the price of good X makes it relativley cheaper to other substitutes (Y,Z) so demand for X increases but may fall for Y and Z unless they change their price also
- this depends on how close the substitutes are, if they're very close, consumers are likley to swap to the cheapest.
- also depends on factors such as brand loyalty
Causes of Shifts of the Demand Curve
Price is the only thing that can cause shifts along the demand curve causing a contraction or expansion of demand.
What causes shifts inwards/outwards:
- P opulation - ^population ^demand as more people wanting and buying at the same price ^net migraition ^demand and vice versa
- A dvertising and marketing - increasing these would expect an increase in demand as potential consumers are told or reminded about the product/brand and may buy
- S ubstitute goods - the closer the substitute, the larger the effect they have on eachother
- I ncome of consumers - ^real income ^disposable so ^ability to purchase goods and services ^demand. if decrease real income, then opposite effect
- F ashion - social and economic factors, whats trendy ^demand for those products
- I nterest rates/ income tax - decreased interest rates encourage spending so ^demand (^IR encourages saving so decrease demand). ^tax decreases disposable income so decreases demand
- C ompliment goods - eg cereal and milk, if price of one increases, demand for both may decrease, consumers may switch to an alternative eg toast
Utility
Utility is a measure of satisfaction we get from purchasing and consuming a good or service
- total utility is the total satisfaction from a given level of consumption
- marginal utility is the change in satisfaction from consuming an extra unit
The idea of diminishing returns means that the marginal utility of extra units declines as more is consumed
The paradox of value:
the diamond water paradox explores how we need water to survive but we don't need diamonds, but water is significantly less valuable than diamonds
- value in use: drinking water satisfies thirst
- value in exchange: what a resource can be sold for in exchange for other products
Factors Determining Demand
- Seasonality: refers to fluctuations in output and sales related to seasons of the year, eg demand for baubles peaks at xmas, or easter eggs at easter. 80-90% of jewelery sales are around xmas
- Social factors: eg social awareness of health issues like smoking, changing of social norms eg shift to paper bags, social pressures like peer pressure
- Emotional factors: eg demand for health insurance after major incidents, times of personal insecurity with binge drinking/eating
Derived and Composite Demand
Derived demand for a factor of production used to produce another good or service eg wool and steel are used for construction so ^construction ^demand for wool and steel
- end use of wood in the UK is 60% in construction, so ^construction ^demand for wood
Composite demand exists where goods have more than one use - an increase in demand for one product leads to a decrease in supply for the other products using the same goods to produce them
- eg milk is used for milk, cheese, yoghurt and butter
Price Elasticity of Demand
Price elasticity of demand (PED) measures the extent to which the demand for a good changes for a good changes in response to a change in the price of that good
PED = percentage change in quantity demanded / percentage change of price
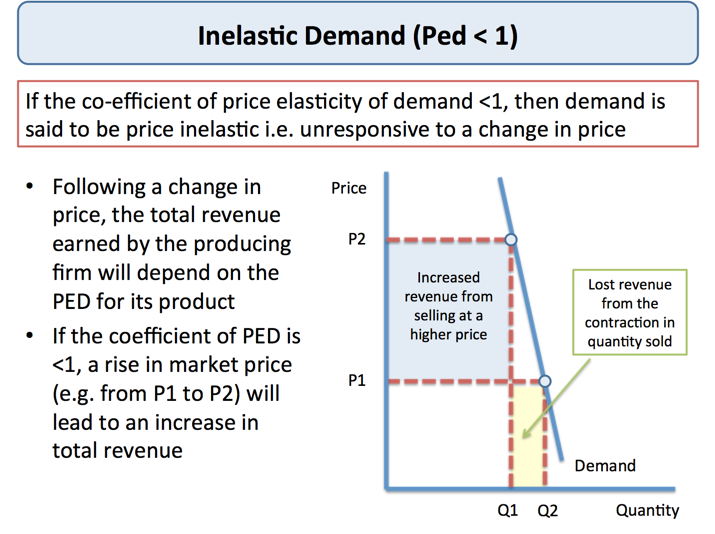
Inelastic demand (PED < 1)
goods such as life saving medicines, drugs and cigarettes (addictive), fuel, wheat, milk, rice.
A large change in price will have little effect on demand, as the goods are necessary, so will always be demanded
Elastic Demand (PED > 1)
A small change in price here (25p) has a very large impact on the change in quantity demanded (6). The demand is highly responsive to price change. The smaller box is the decrease in revenue from selling at a lower price, but the box for the increase in revenue from increased quantity is much bigger so increased total revenue.
Examples of elastic goods are cars, clothing, soft drinks
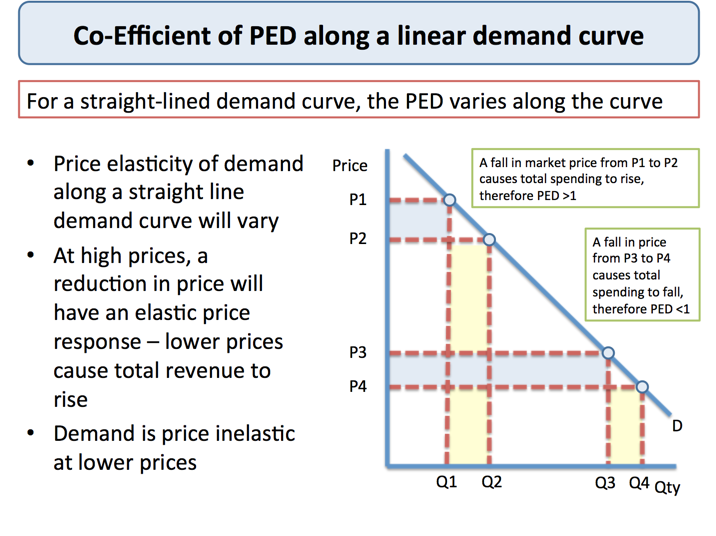
Linear Demand Curve
Unitary Demand (PED = 1)
eg electronics
Perfectly Inelastic Demand (PED = 0)
eg essential foods, tobacco, water
Perfectly Elastic Demand (PED = infinity)
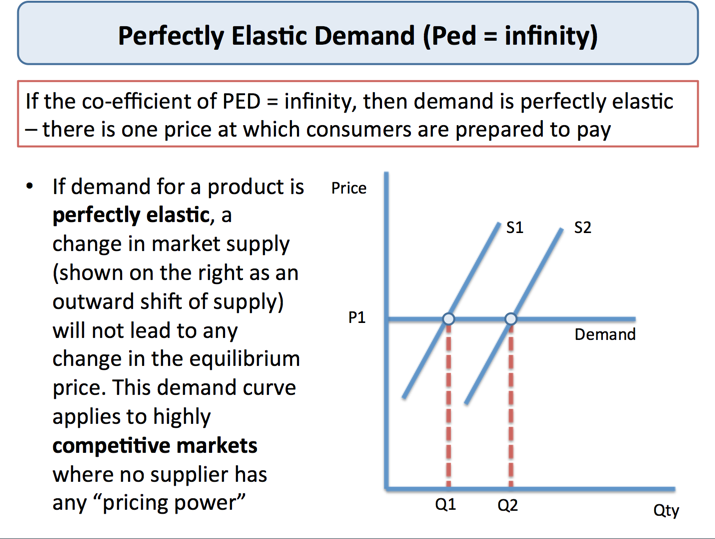
eg products with many close substitutes
Factors of PED
- number of substitutes, the more substitutes, the more elastic
- price of product in relation to income, when % of the budget is high, demand is likley price sensitive (elastic)
- cost of substituting between different products eg cancellation fees or time taken to switch providers of wifi or phones
- brand loyalty and habitual consumption, if loyal and is a habit, product will be less elastic
- degree of necessity/luxury , necessities have less price elasticity as consumers need them regardless of price
Income Elasticity of Demand
Income elasticity of demand (YED) shows how repsonsive the demand for a product is to a change in (real) income
%change in quantity demanded / %change in real income
The type of good that it is determines how elastic it is in relation to a change in income
Income Elastic (YED > 1)
An increase in income leads to a bigger increase in the quantity demanded of the good.
These are normal goods, the demand curve will shift outward for these goods with an increase in income.
Normal necessities: low but +ve YED eg milk
Normal luxuries: high and +ve YED eg cars, technology
Income Inelastic (YED < 1)
As income increases, quantity demanded decreases
Inferior goods eg own brand products or things like rice, when incomes increase, consumers will switch to more expensive/luxury goods. Inferior goods are countercyclical as they don't follow economic cycles.
Perfectly Elastic Income (0
The demand for these goods doesn't change much with a change in income. If income ^ demand barely changes, this is because they are necessities, meaning income increases won't really increase the demand for bread, as consumers already needed it
Cross Elasticity of Demand
Cross elasticity of demand (XED) measures the responsiveness of the demand for good X following a change in the price of a related good
% change of quantity demanded of good X / % change of price of good Y
Substitutes:
- prodcuts are in competitive demand
- increase in price for one good will lead to an increase in demand for the rival product
- value of XED is always positive
- Compliments:
- products in joint demand
- fall in price of one product will lead to an increase in demand of the complimetary product as well as the original product
- value of XED is always negative
- Branding and brand loyalty have a lot to do with PED, YED and XED. Even with changes in price, brand loyalty may mean not much change in demand
Substitutes
close substitutes eg bread and cereal
weak substitutes are likely branded products like Apple, people are unlikley to swap
XED >1
Compliments
close compliments are like cars and fuel
XED < 0
Supply
Supply is the quantity of a good or service that a producer is willing and able to supply to the market at a given price level in a given time
The basic law of supply is that the price of a product rises, so businesses expand supply to the market (more profit to be made)
increased market price gives a profit incentive for suppliers, so as price rises, supply expands. When output expands, costs of production tend to rise, so a higher price is needed to cover the extra costs. More entrants coming into the market at higher prices as more profit can be made (incentive)
Causes of Shifts of the Supply Curve
- P roductivity - ^productivity can cause a shift outwards
- I ndirect taxes - increasing can cause an inward shift of supply (VAT)
- N o. of firms in the market, if ^ then an outward shift (this is usually caused by an increase in price)
- T echnological advancement - outward shift if production technology improves
- S ubsidies (grants) - cause outward shift as they can decrease costs of production
- W eather conditions - eg in agriculture, poor/ unfavourable conditions can cause an inward shift
- C osts of production - if decrease costs, more can be supplied at each price level so causes an outward shift
Joint Supply
Joint supply is where an increase or decrease in the supply of one good leads to an increase or decrease in the supply of a by-product
Eg:
- an expansion in beef production will lead to rising market supply of beef hides
- a contraction in the market supply of lamb will reduce the supply of wool
- wheat and straw
- cotton and cotton seed
Price Elasticity of Supply
Price elasticity of supply (PES) measures the relationship between a change in quantity supplied and a change in price
% change in quantity supplied / % change in price
can be elastic or inelastic
If supply is elastic, producers can increase their output without a rise in cost or time delay.
If supply is inelastic, firms find it hard to change their producion in a given time period
PES Graphs
elastic supply eg pizza, bread, books inelastic supply eg farming/fishing or growing crops (takes time to increase output)
Perfectly Elastic / Inelastic Supply
Factors Effecting PES
- B arriers to entry - prevents producers form entering the market, eg brand loyalty, copyrights / patents
- R aw materials - readily available / easily available means elastic (vice versa)
- I nventory - if they hold stock, can be more responsive and therefore elastic. Perishable stock may not be stored, making supply more inelastic
- T ime - eg in agriculture and farming, time taken to grow crops / breed animals
- S pare capacity - if spare capacity, elastic, if no spare capacity, less responsive (inelastic)
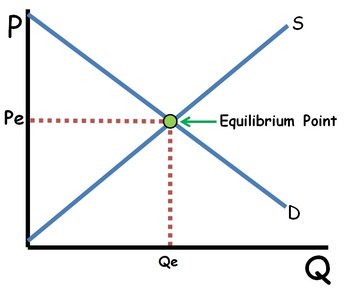
Market Equilibrium and Disequilibrium
Equilibrium means a state of equality or balance between market demand and supply. This is the price where demand and supply are out of balance are called points of disequilibrium.
Adam Smith's invisible hand links with this. meaning they work them selves out, ^ demand leads to ^ supply, and the other way around
An equilibrium is when demand = supply
The ruling market price / ruling market supply is the price where demand = supply (equilibrium)
Disequilibrium
At a disequilibrium, more is supplied than demanded, or more is demanded than supplied
- Supply - ^ price ^ supply
- Demand - ^ price decreases demand
Glut - supply > demand shortage - demand > supply
Shifts in Equilibrium
Moving Equilibrium
Excess Supply
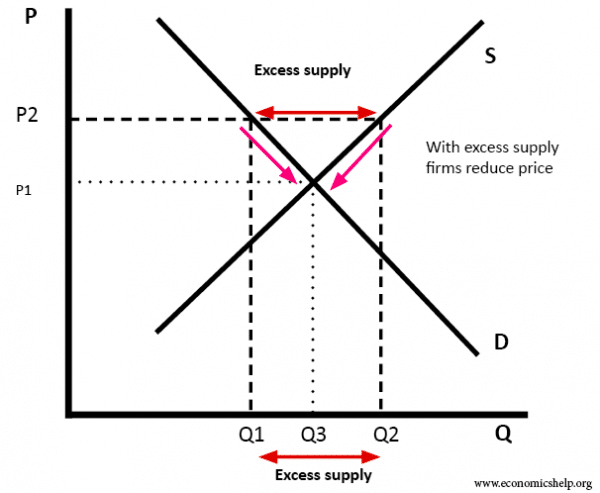
This is when a market is at disequilibrium, at P2, suppliers are willing to produce Q2, but only Q1 is demanded. (Q3 is the equilibrium / market price)
Excess Demand
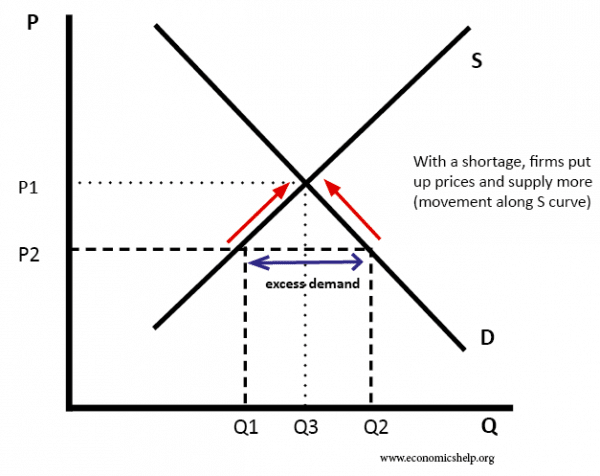
At P1, there is an equilibrium, but at P2, Q1 is supplied but Q2 is demand. There is more demand than supply so excess demand.
The Price Mechanism
Issues such as opportunity cost and trade offs are resolved by price.
- Allocate - allocating scarce resources among competing users
- Rationing - prices serve to ration scare resources when market demand outstrips supply
- Signalling - prices adjust to demonstrate where resources are required, and where they are not
- Incentives - eg when the price of a product rises, quantity supplied increases as businesses respond
The Rationing Factor
The rationing factor is when a shortage of products leads to an increase in price and deter some consumers from buying the product
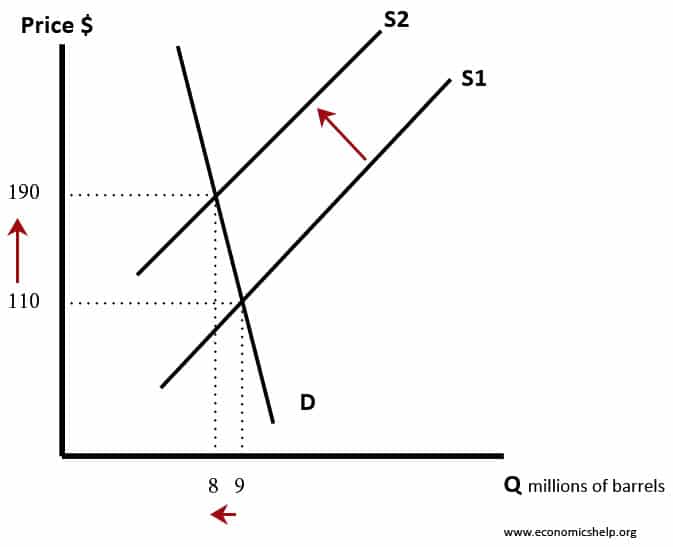
Inward shift of supply increases price, so less is demanded at that price
The Signalling Function
The signalling function is when changes in price provide information to both producers and consumers about changes in market conditions
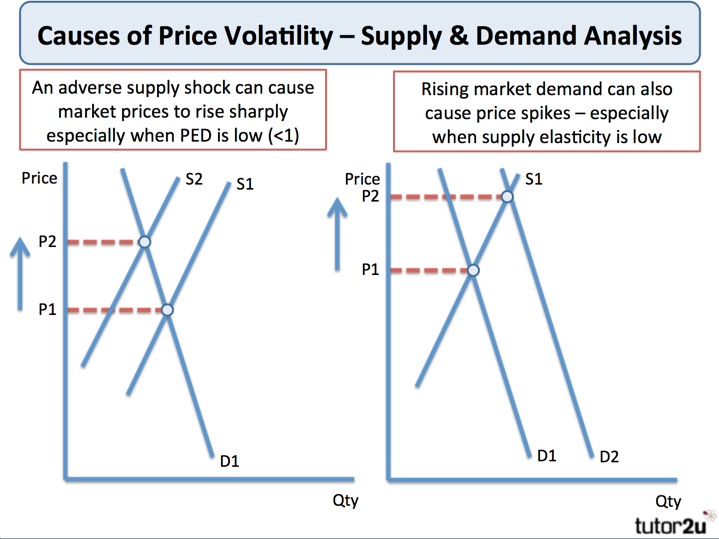
Price Volatility
The Housing Market
There was a surge in house prices between 2004 and 2007, this was a direct result of the credit boom and as a result, property prices climbed to unsustainable levels. The recession helped bring prices down but in 2013 they started to rise again at a fast rate and they continued to rise i 2014 and 2015
Interest rates decreased in 2014, (so lower cost of borrowing) and demand for housing increases and increased prices
Houses have a low PES as there is lots of time taken to plan and build and limited resources eg land/space
The demand for housing is the quantity of properties homebuyers are willing and able to buy at a given price and a given time period (PASIFIC)
The supply of housing is the flow of properties available at a given price in a given time period time period. Supply is a mix of new and older housing
Supply of Housing
Things affecting supply:
- Cost of production for construsction companies
- No. of construction companies and their objectives
- extent to innovation achieved in the housing industry
- government taxes and subsidies
- government spending on building on new social housing
Interrelationship Between Markets
Involving implications of joint demand, demand for substitute goods, composite demand and joint supply
See other cards for it
Related discussions on The Student Room
- Cournot Calculation help! »
- Economics a level »
- economics micro monopolistic competition »
- Market structures help »
- micro economics monopolistic competition »
- Edexcel A Level Economics A Paper 3 (9ECO 03) - 5th June 2023 [Exam Chat] »
- Unveiling the Realm of Investment Banking »
- State pretend incompetence »
- Financial Development Stage: Spot - Futures - Options? »
- Business Studies A-Level Pearsons Edexcel PAPER 3 »
Comments
No comments have yet been made