1.2 THE MARKET
- Created by: Rachminova
- Created on: 22-01-19 12:22
1.2.1 DEMAND
DEMAND
- Demand is the amount society is willing and able to buy at a set price at a given point in time
- A normal good is one where, if price rises, demand will fall and vice versa i.e. there is a negative correlation
- the two variables price and demand move in the opposite direction to each other
- The relationship between price and quantity demanded can be shown using a demand curve
- A demand curve is a graphical representation of the relationship between price and quantity demanded
- The demand curve shows the quantity demanded for a good, at any given price, over a period of time
- As the price falls quantity demanded rises
- As the price rises quantity demanded falls
1.2.1 DEMAND
THE DEMAND CURVE
Rules for drawing a demand curve:
i) label the y axis price and the x axis quantity
ii) draw the demand curve downward sloping from left to right and label it demand (or D)
iii) to find the quantity demanded at any given price:
- a) select a price (P), shown on the y axis
- b) draw a dotted line towards the demand curve
- c) draw a dotted line down towards the x axis to show quantity (Q)
1.2.1 DEMAND
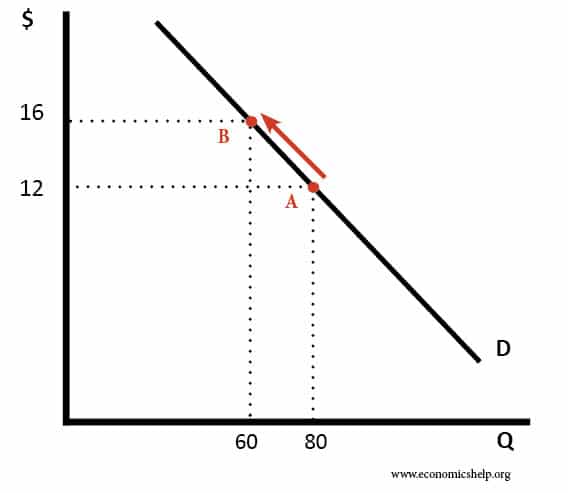
THE DEMAND CURVE
- A change in price from £12 to £16 is shown by a movement along the demand curve lowering quantity of demanded from 80 to 60 units
1.2.1 DEMAND
FACTORS LEADING TO A CHANGE IN DEMAND
- If a change in demand is caused by a change in price this is shown by a movement along the demand curve
- If the change is demand is caused by a change in any other factor this is caused by a shift in the demand curve
THESE ARE:
- Changes in the prices of substitutues and complementary goods
- Changes in consumer incomes
- Fashions, tastes and preferences
- Advertising and branding
- Demographics
- External shocks
- Seasonality
1.2.1 DEMAND
CHANGES IN THE PRICES OF SUBSTITUTE AND COMPLEMENTARY GOODS
This will have a major impact on the quantity demanded of a product
- A substitute acts as an alternative, therefore creating competition
- If the price of good A increases, the demand for good B will increase e.g. Coca-Cola and Pepsi Cola
- There is a positive correlation
- A complementary product is bought alongside a good or service
- If the price of good A increases, the demand for good B will decrease e.g. fish and chips
- There is a negative correlation
1.2.1 DEMAND
CHANGES IN CONSUMER INCOMES
- As the income of consumers increases the demand for some goods and services will increase
- Does this depend on the nature of good?
- NECESSITIES
- It is less likely that the demand for these will change in relation to income
- LUXURIES
- if income increases customers may be able to afford more luxuries increasing demand, equally if incomes fall these may be the first items to cut e.g. not booking a holiday
- INFERIOR GOODS
- if incomes increase demand may increase demand may decrease as customers switch to being able to afford a better quality product
1.2.1 DEMAND
FASHION, TASTES AND PREFERENCES
- People's tastes change over time and demand for fashionable products changes regularly
- As some products become more fashionable there is an increase in demand
- Just as quickly demand can disappear as tastes and fashion change
ADVERTISING AND BRANDING
- Advertising is a promotional method that involves the use of media to communicate with existing and potential consumers
- Purpose is to generate awareness and desire
- Branding is a promotional method that involves the creation of an identity for a business that distinguishes the firm and its products from competitors
- If successful both advertising and branding will lead to an increase in demand
- However if brand reputation is damaged or advertising gives the wrong message demand can decrease
1.2.1 DEMAND
DEMOGRAPHICS
- Demographic factors are the statistical characteristics of the population, these include the population, these include for example:
- Age
- Gender
- Ethnic mix
- Migration has seen an increase in demand for a wide range of goods and services e.g. housing, public transport and healthcare
- Demographics also influences the types of products demanded e.g. changing taste of a more diverse nation and different demands from an ageing population
1.2.1 DEMAND
EXTERNAL SHOCKS
- External shocks are unexpected events that are outside of the business control but have a direct impact on the level of demand
- Consider how each of the following Examples of external shocks and how they could influence the demand for certain goods and services:
- 2008 global finance crisis
- Flash floods in the south of the uk
- Outbreak of disease e.g. foot and mouth or bird flu
1.2.1 DEMAND
SEASONALITY
- Seasonality refers to the fluctuations in demand depending upon the time of year
- Seasonality exists because of:
- Changes in weather
- Public holidays e.g. Christmas and Ramadan
- Consider how seasonality affects the demand for the following goods and services:
- Child care
- Fashion
- Confectionery
- Household utilities
- Caravan parks
1.2.1 DEMAND
SHIFTS IN THE DEMAND CURVE
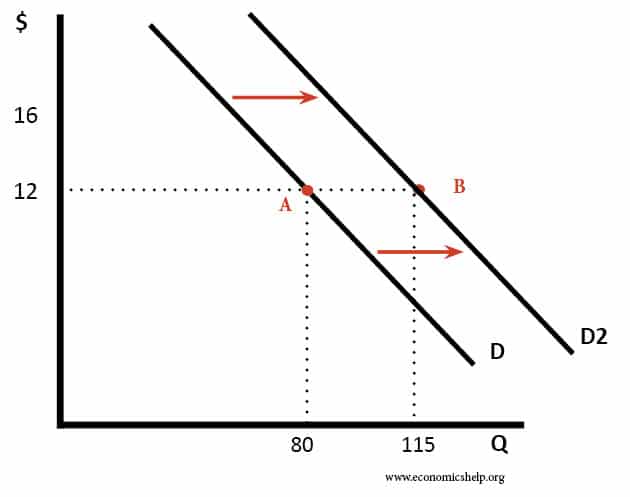
- If the change in demand is caused by any factor other than price then the demand curve shifts
- An increase in demand is shown by a shift to the right
- A decrease in demand is shown by a shift to the left
1.2.2 SUPPLY
SUPPLY
- Supply is the amount of a good or service that producers are willing and able to sell at any given price
- Producers are those people that create and supply goods and services to a market
- A supply curve is a geographical representation of the relationship between price and quantity
- The supply curve shows the quantity supplied for a good or service, at any given price, over a period of time
- As price falls quantity supllied decreases
- As price rises quantity supplied increases
1.2.2 SUPPLY
THE SUPPLY CURVE
A fall in price from £0.50 to £0.20 is shown by a movement along the curve showing a all in the quantity supplies from 400 units to 100 units

1.2.2 SUPPLY
CHANGES IN COSTS OF PRODUCTION
Costs of production are created by the price of factor inputs i.e. the factors of production
- If the cost of producing a good or service increases it will become more expensive to supply the product
- This will lead to some firms reducing output
- The price of factor inputs can also be reduced making it cheaper to supply a product
- There will be an increase in supply
- Improvements in technology can help to reduce costs of production
1.2.2 SUPPLY
INTRODUCTION OF NEW TECHNOLOGY
- Technological progress has meant that firms can produce in a more efficient and cost effective manner
- Improved large scale machinery allows them to spead fixed costs over greater output making the cost per unit produced cheaper
- As technology improves firms find it profitable to supply more produts
INDIRECT TAXES
- Taxation is a charge placed on individuals or firms; governments use taxation to finance their spending
- Indirect taxes ae those placed on goods and services produced by individuals and firms
- Value added tax (VAT)
- Duties
- If indirect taxes are increased it becomes more expensive to produce a product
- Therefore, the quantity supplied of that product will decrease
1.2.2 SUPPLY
SUBSIDIE
- Subsidies involve finance provided by the government to encourage suppliers to produce goods and services
- Subsidies will make it cheaper to produce a product
- Therfore, the quantitiy supplied of that product will increase
- The withdrawel of subsidies will make it more expensive to produce a product
- Therefore, the quantity supplied of that product will decrease
1.2.2 SUPPLY
EXTERNAL SHOCKS
- External shocks are unexpected events that are outside of the businesses control but have a direct impact on the level of supply
- Consider how each of the following external shocks could influence the supply for certain goods and services:
- Natural disasters around the world
- Terrorist attacks
- Outbreak of disease e.g. foot and mouth or bird flu
1.2.2 SUPPLY
SHIFTS IN THE SUPPLY CURVE
- A change in any factor other than price e.g. new tech. is shown by a shift in the supply curve.
- An increase in demand is showed by the shift from "S to S1" and a decrease in demand is shown by the shift from "S to S2"

1.2.3 MARKETS
THE INTERACTION OF SUPPLY AND DEMAND
- Supply and Demand can be shown on one diagram
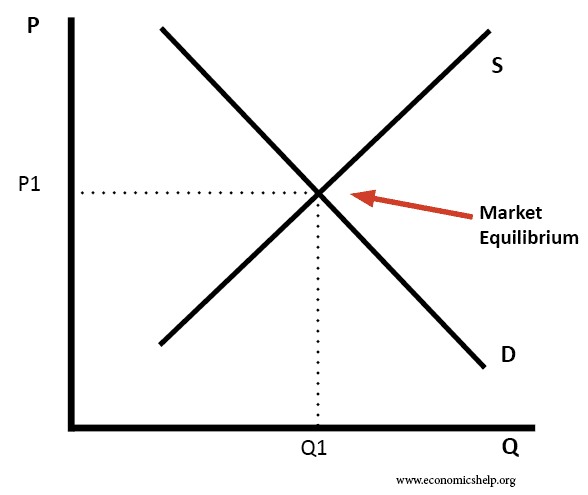
- MARKET EQUILIBRIUM is the point at which demand is equal to supply i.e. where the supply and demand cross
- This is called equilibrium point or equilibrium price
- This is known as the Market Clearing Price as all products will be sold at this price
- All buyers can get the exact amount that they want to buy at this price and all sellers provide exactly the amount that they want to sell at this price
- Therefore, there is noting left over i.e. the market has cleared
- Any change in demand or supply will lead to a new equilibrium price
1.2.3 MARKETS
THE INTERACTION OF SUPPLY AND DEMAND
- The equilibrium point can be shown graphically
1.2.3 MARKETS
THE DRAWING AND INTERPRETATION OF SUPPLY AND DEMAND DIAGRAMS
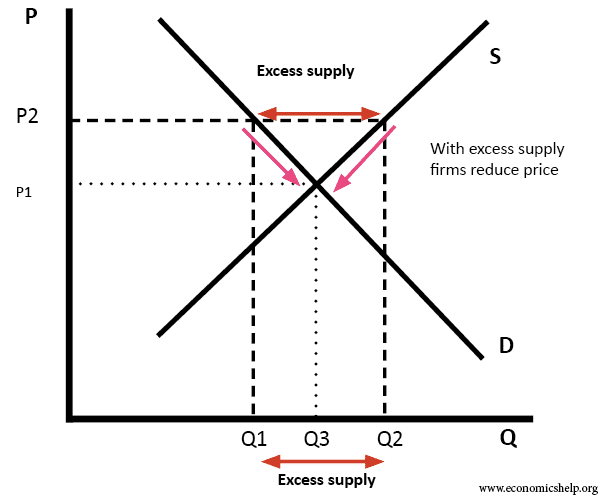
Excess Supply:
1.2.3 MARKETS
Excess Demand:

1.2.3 MARKETS
Market Forces:
MARKET FORCES are always pushing price towards market equilibrium
- The price at which demand equals supply and there are no products left over in the market. - Too much supply leads to lower prices, too much demand leads to higher prices.
- It is important to remember that:
- a change in price will lead to a movement along the supply or demand curve
- However
- a vhange in any other factor will lead to a shift in the demand or suppy curve
A SHIFT IN THE DEMAND CURVE WILL OCCUR DUE TO CHANGES IN: - Consumer income - Prices of other goods and services
A SHIFT IN THE SUPPLY CURVE WILL OCCUR DUE TO CHANGES IN: - Technological progress - Government policy e.g. taxes and subsidies
1.2.3 MARKETS
THE DRAWING AND INTERPRETATION OF SUPPLY AND DEMAND DIAGRAMS
Shifts in the demand curve can be shown graphically
1.2.3 MARKETS
SHIFTS IN THE SUPPLY CURVE CAN BE SHOWN GRAPHICALLY:

1.2.3 MARKETS
THE DRAWING AND INTERPRETATION OF SUPPLY AND DEMAND:
QUESTION:
What will happen when there is a decrease in supply?
- A decrease in supply will see the supply curve shift upwards and towards the left. This will cause the price to rise and the quantity supplied to fall. At this point we have a new market equilibrium. The shift in supply has led to a movement along the demand curve.
1.2.4 PRICE ELASTICITY OF DEMAND
PRICE ELASTICITY OF DEMAND (PED)
- Price elasticity of demand is a measure of how responsive demand is to a change in price
- There is an inverse relationship between price and demand
- As price goes up demand goes down
- As price goes down demand goes up
- PED is price INELASTIC as the fall in demand is less than the fall in price
- Price increases by 10% - Demand falls by 5%
1.2.4 PRICE ELASTICITY OF DEMAND
PRICE ELASTICITY OF DEMAND (PED)
- Price increases by 10% - Demand falls by 13%
- PED is price ELASTIC as the fall in demand is greater than the fall in price
- Price ELASTIC demand means that achange in price will lead to a more than proportional change in demand i.e. demand is snesitive to price changes
- Price INELASTIC demand means that a change in price would lead to a less than proportional change in demand i.e. demand is not sensitive to changes in price
1.2.4 PRICE ELASTICITY OF DEMAND
PRICE ELASTICITY OF DEMAND (PED)
PED can be calculated using the formula of:
% change in quantity demanded
---------------------------------------------- = PED
% change in price
EXAMPLE: A newsagent sells 200 cans of coca-cola a week at the price of £0.50. The newsagent raises the price of the coca-cola to £0.60 and demanded falls to 180 cans. What is the PED for this product?
1.2.4 PRICE ELASTICITY OF DEMAND
ANSWER:
Change in demand -20
1) ---------------------------- x 100 ----------- x 100 = -10%
Original Demand 200
Change in price 10
2) --------------------------- x 100 ----------- x 100 = 20%
Original Price 50
% change in QD -10
3) ---------------------------- x 100 ----------- =-0.5
% change in P 20
1.2.4 PRICE ELASTICITY OF DEMAND
PRICE ELASTICITY OF DEMAN (PED)
- In business it is assumed that the PED will always always be negative i.e. price and demand will always move in the opposite direction
- If PED is between 0 and -1 e.g. -0.7 then demand is price inelastic
- If PED is less than -1 e.g. -1.4 then demand is price elastic
A number of factors affect the value of the PED coefficient including:
- The Availability of Substitutes - the closer the substitutes and the more that are available the higher the price elasticity of demand
- The Price Of Competitor Goods - if the price of goods in competition with a product increase this will affect demand and price elasticity of demand
- Time - the longer the time period the higher the price elasticity of demand. Given more time other firms have the ability to produce similar products and customers have more chance of adapting their buying habits
1.2.4 PRICE ELASTICITY OF DEMAND
FACTORS INFLUENCING PED
- Branding - firms spend time and money building up their brand image. By creating brand loyalty firms know that their customers will be willing to pay more for the product and they can therefore raise prices as the PED is lower
- Income - If consumer incomes are higher then the issue of price becomes less important to the consumer and it is easier for firms to raise price as the PED is lower
- Nature of the good
- A luxury good will be price elastic as demand will be more sensitive to changes in price
- A necessity good will be price inelatic as demand will be less sensitive to changes in price
1.2.4 PRICE ELASTICITY OF DEMAND
THE SIGNIFICANCE OF PED IN TERMS OF IMPLICATIONS ON PRICE
- Business people want to know how a change in price will impact on revenue
- This will help determine whether changing price is a good or bad marketing decision
Price elastic demand Price inelastic demand
Raising selling price Sales revenue will Sales revenue will increase
decrease
Lower selling price Sales revenue will Sales revenue will decrease
increase
1.2.4 PRICE ELASTICITY OF DEMAND
THE SIGNIFICANCE OF PED
- Price inelastic – if a product is price inelastic then a firm knows that if it raises price, even though demand will fall, total revenue will increase.
- This can be shown mathematically.
- Price = £1.00 Demand = 100 units
- What is total revenue? Price x demand
- £1.00 x 100 units = £100
- PED = - 0.5
Should the firm raise price?
If the firm were to raise price by 10 pence, from £1.00 to £1.10, this is a 10% price rise (10%).
Using the PED formula: % change in Qd = - 0.5 = 10%
1.2.4 PRICE ELASTICITY OF DEMAND
THE SIGNIFICANCE OF PED
Rearrange the formula:
-0.5 x 10% = 5%
- There is a 5% change in demand
- PED is –ve therefore in this case when price goes up by 10% demand goes down by 5%
- Demand will go down from 100 units to 95 units
What is total revenue? Price x demand
£1.10 x 95 units = £104.50
- By raising the price of a price inelastic product the firm has increased TR.
- TR will fall if the firm attempts to lower price.
1.2.4 PRICE ELASTICITY OF DEMAND
PROBLEMS OF FORECASTING PRICE ELASTICITY OF DEMAND
The price elasticity of demand for a product is constantly changing in a dynamic world
- It is very difficult for firms to measure because:
- Difficulty in finding accurate information
- Price elasticity changes over different price ranges
- Price elasticity will change over the period of the economic cycle e.g. it will be affected in a recession
- Tastes and fashions are constantly changing
- Competitors don’t stand still
- They are continually improving existing products, bringing out new products and trying to promote their products
1.2.5 INCOME ELASTICITY OF DEMAND
INCOME ELASTICITY OF DEMAND
- Income Elasticity of Demand (YED) is a measure of the responsiveness of demand to a change in income
- The relationship between price and demand was straight forward they always moved in the opposite direction
- Income elasticity of demand can be negative or positive i.e. income and demand can move in the same direction or the opposite direction
- when demand for a product increases when incomes increase we call this a normal good
- normal goods will always have a positive income elasticity of demand i.e. a + sign
- when demand for a product decreases when incomes increase we call this an inferior good
- inferior goods will always have a negative income elasticity of demand i.e. a - sign
1.2.5 INCOME ELASTICITY OF DEMAND
YED
- Calculated by the formula:
% change in quantity demanded
------------------------------------------------- = YED
% change in income
EXAMPLE:
incomes increase by 15%
- This leads to an increase in demand for ipads of 20%
- The income elasticity of demand is = 20/15 = +1.33
1.2.5 INCOME ELASTICITY OF DEMAND
INCOME ELASTICITY OF DEMAND
YED coefficient TITLE Relevance to Business
-1<+1 Income Inelastic Demand changes at a lower proportion than the change in income
< -1 or > + 1 Income Elastic Demand changes at a higher proportion than the change in income
1.2.5 INCOME ELASTICITY OF DEMAND
FACTORS INFLUENCING INCOME ELASTICITY OF DEMAND
- Income elasticity of demand is determined by:
- whether the good is necessity or a luxury
- at higher standards of living increased consumer incomes see additional demand tend towards luxury goods as demand for necessities is satiated
- the level of income of a consumer
- poorer consumers tend to spend their income on necessities
- as they become wealthier the YED for necessities moves towards zero as consumers are satisfied with the amount of the product e.g. staple foods that they can buy
Normal goods that are necessities will have lower positive YED coefficients
- as consumer incomes increase they are likely to spend some of their income on luxuries
- These products e.g. cars and foreign holidays will have higher positive YED coefficients
1.2.5 INCOME ELASTICITY OF DEMAND
NORMAL GOODS
There are two types of nomal goods:
NECESSITIES - products that have a positive YED that is between 0 and 1
LUXURIES - products that have a positive YED that is greater than 1
YED RELEVANCE TO BUSINESS
- STANDARDS OF LIVING
- wealthier countries are likely to have consumers with higher disposable incomes
- this means that they have greater spending power and are likely to use some of this greater income to buy luxury goods and services
- Therefore, firms will produce superior products that meet the needs of these consumers e.g. high technology goods and complex financial services
Related discussions on The Student Room
- Are there any marketing degrees which are not along side a management degree »
- What are the best degrees to work in marketing? »
- Graudate jobs »
- Marketing or digital marketing »
- Marketing degrees are they useless? »
- Which is the Best Digital Marketing Institute in Laxmi Nagar? »
- What is Digital Marketing like at uni? »
- Could someone please help with some feedback »
- Can I work in marketing with a fashion design ba »
- PR/Advertising short courses or experience in Northern Ireland »
Comments
No comments have yet been made