Tectonics theory
- Created by: Kate_anderson
- Created on: 26-04-18 18:53
Factors affecting death toll
Wealth: afford solid infrastructure, quick response & health care units
Education: citizens know how to respond and the correct actions to take in an emergency
Population density: quantity of people affected in one area
Experience: An area prone to disaster knows what to expect and how to respond, could also lead to negative effects e.g if a developing country is hit by an earthquake and then once more- no time to recover
Location: if it is in an area where there is a high population density such as a city or shanty town
Contacts: whether the government has a good response team with contacts with other countries for aid and support.
Degg's disaster model
= interaction of human and physical circles

Occurs when population can't:- Anticipate (before) e.g predict with tech
- Cope with (during) e.g secure buildings, evacuate
- Recover from (after) e.g organise emergency response, recover roads etc
Movement of tectonic plates
Mantle Convection: Radioactive decay of inner core produces heat= mantle rises & CC form- NOT UNIVERSALLY ACCEPTED TODAY
Slab pull: Oceanic plate forms at mid-ocean ridges, plates diverge & cool:
-become denser= sink/subduct into asthenosphere excerting force
& pulling plate/itself behind
Seafloor spreading (ridge push): magma rises between diverging plates & erupts as lava = forms mid-ocean ridge
Oceanic plates pushed apart by force of mid-ocean ridge
THESE ALL COMBINE- convection currents drive plates, lava rises = ridge push, old plates subduct= slab pull
Earth's structure
(I) Inner core =solid
(Once) Outer core = molten & hot due to radioactive decay (4000-6000C)
(Made) Mantle =semi-molten & plastic so can flow, 2300km thick
(A ) Asthenosphere = semi-molten plastic layer of upper mantle
(Massive) Moho = (the mohorovicic discontinuity)
(Lemon) Lithosphere =crust & solid uppermost mantle (which has cooled & stuck to crust), thin, cool & rigid = broken into tectonic plates
(Cake) Crust
Continental vs Oceanic
Continental Oceanic
· Solid rock = form continents Solid rock= form ocean floors
Can extend out to sea to form underwater continental shelf Covers 65% of Earth’s surface
Relatively thick- 70km from peak to depth in mountains Relatively thin- 6km
Low density-60% silica content High density- composed of Basalt
Plate tectonics theory
= describes movement of Earth’s tectonic plates & builds on earlier discoveries of
-continental drift (Pangea & continental puzzle)
- Seafloor Spreading
- Earth’s structure
Destructive plate boundaries
=Convergence of two plates; where subduction= high risk cone volcanoes & viscous lava
O & C: Oceanic plate subducts & melts due to heat and friction from mantle
Magma rises through faults in continental plate & erupts as lava to form chain of volcanoes
Continental plate crumple upwards to give fold mountains &also volcanoes= The Andes
O & O: Denser/older plate subducts
Magma erupts to form submarine volcanoes and an island chain= The Antilles
C& C: Collision, plate margins & sediments crumple to give fold mountains=the Himalayas
All = High risk Earthquakes: shallow, intermediate & deep due to friction in Benioff Zone, magnitudes high and focus potentially shallow
Paleomagnetism
= provides evidence for divergence of plates
Rocks formed at different times in history have their magnetic minerals lined up in different directions- when erupting lava cools the magnetic minerals lock in Earth’s polarity at the time. At mid-ocean ridges the same patterns of magnetic direction stretched away from each other indicating the matchings rocks on either side of the ridge had formed at the same time and then diverged.
Constructive plate boundaries
Diverging margins usually between two oceanic plates
Ø Low risk (non-viscous lava) shield volcanoes mainly on ocean floor= Mid-Atlantic ridge
Ø Little friction= low risk earthquakes of low magnitude & shallow focus
Ø When between two continental plates= volcanoes and rift valleys e.g East African rift valley
Conservative plate boundaries
Two plates sliding past each other
Ø Movement along boundary
Ø Mostly oceanic-oceanic but can be continental-continental e.g San Andreas Fault
= no volcanoes as no subduction or divergence
= High risk earthquakes at continental as magnitudes are high and focus shallow due to friction
Predicting volcanoes- methods
Seismic Activity
Ground deformation
Thermal Changes
Gas emissions
Rising magma triggers seismic activity- measured with seismometers & is usually first indication of ‘volcanic unrest’
Type & intensity of seismic activity= when eruption likely to occur
Rising magma changes shape of volcano due to heat and pressurisation.
Tiltmeters, strainmeters, GPS and satellite images used to measure even smallest swellings.
Rising magma heats crust- infra-red satellite images= thermal mapping to detect any warming of crust.
These can be done remotely reducing risk and making process less time consuming & allows measurement of hard to reach areas.
Gases escape from magma as it rises- correlation spectrometers measure gas concentrations.
Sudden rise= pressure building in volcano which may lead to violent eruption
Predicting volcanoes- drawbacks
= mostly only available in developed world but can still go wrong.
e.g Japan 2014, despite complex monitoring systems Mount Ontake erupted without warning killing 47 unsuspecting people.
Measuring earthquakes- Moment magnitude scale
Moment Magnitude Scale:
= total energy released at epicentre at seismic moment.
Includes: size of seismic waves, amount of slippage, area of fault affected
Scale starts at 1 but is infinite and is logarithmic e.g Japan 2011 earthwuale = 9.0 and released 1000x more energy than Haiti 2010- 7.0.
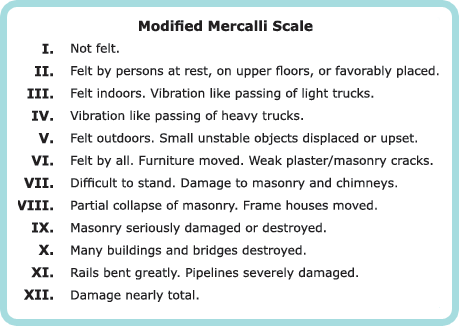
Measuring Earthquakes- Modified Mercalli Scale
= Uses witness observations (subjective)
Includes: impacts on natural environment, people, and structures
Scale ranges from I (hardly noticed) to XII (catastrophic)
Types of lava
Basaltic Lava
Andesitic Lava
constructive boundaries & hot spots
Destructive subductive boundaries
Low viscosity = runny
High viscosity = sticky
Gases escape freely
Gases trapped in magma and explode out
Effusive = gentle
Explosive= violent
Low risk & frequent
High risk & infrequent
Eruptions usually VEI 0-3
e.g Kilauea Hawaii, VEI= 0
Eruptions usually VEI 4+
e.g Mt Pinatubo Philippines, VEI=6
VEI
= Volcanic Explosivity Index, measuring eruption magnitude
Includes: amount & height of erupted material, duration of eruption, description (e.g violent/effusive)
Scale ranges from 0-8 non-explosive to extremely explosive = logarithmic
Seismic waves- P waves/ Primary/Pressure waves
Ø Travel from focus
Ø Push through Crust, Mantle & Core
Ø Backwards and Forwards motion
Ø Only damaging in powerful EQ’s
Ø Body waves
Seismic waves- S waves/ Secondary/Shear waves
Ø Travel from focus
Ø Shake through Crust & mantle
Ø Sideways motion at right angles to direction of travel
Ø Body waves
Seismic waves- L waves/Love waves/ Surface waves
Ø Travel from epicentre NOT focus
Ø Shake along ground surface only
Ø Sideways motion at right angles to direction of travel
Seismic waves
= energy released from earthquake
- P waves Speed decreases
- S waves Damage increases as amplitude becomes
- L waves greater
All measured using Seismometer= detects & measures ground movement, recording it on seismograph.
Using speeds of different waves Scientists can calculate time, location & magnitude of EQ.
Cause of a tsunami
- Seafloor uplifted/displaces by EQ/slipping tectonic plates/tectonic event
- Water column directly above & thus ocean surface= displaced, waves radiate in all directions
- Difficult to detect in open water as waves are shallow (0.5-5m) and wave length is long (150-250km)
- Wave energy concentrated into smaller vol. near coast
- Water shallows= waves increase in height 1m waves--->30m waves
- Wave’s crest reaches shore= vacuum & sea floor exposed
- Water returns and floods inland
= soil washed away, trees uprooted, people & infrastructure swept away, land food & water= contaminated by salt sewage & bodies= disease e.g cholera, drowning collapsed buildings & floating debris= death
Predicting tsunamis
DART= Deep-ocean Assessment and Reporting of Tsunami
Uses: seafloor sensors & surface buoys= monitor changes in water pressure and sea level
When tsunami waves are detected, signals are sent via satellite to warning stations, data can then be used to predict size and direction of tsunami.
= gives people chance to evacuate and for emergency procedures to be put into place
BUT not completely reliable… Japan 2011 size of tsunami underestimated, and some didn’t evacuate, despite Japan having most extensive tsunami warning system globally.
The Hazard-Risk Equation
Risk= Hazard x Vulnerability/Capacity to cope
Human factors affect vulnerability/Resilience of country- developing countries + vulnerable to natural disasters than developed.
Physical & environmental Factors
Economic & Social factors
Governance & Politics
High pop. Density= increased low quality housing
Few jobs= no money to prepare/cope with hazard
Level of corruption= resource utilisation
Rapid urbanisation= quick, poor quality housing
Poor health care= less likely to recover from hazard
Existence of Hazard education & practise responses
Accessibility of area for emergency services and supplies
Level of wealth= quality of housing & ability to cope
Quality of communication systems
Lack of education= unaware of risks
Efficiency of emergency services
Quality of infrastructure & building codes and regulations
Pressure and Release model
= identifies causes of vulnerability
Root causes dynamic pressures unsafe conditions = cycle of effects
E.g poverty lack of skills poor quality housing = progression of vulnerability

Hazard Management theory
Aims: Ø Limit life & property (before)
Ø Help those affected (during)
Ø Ensure rapid recovery (after)
Involves:
Ø Government (local, regional & national)
Ø IGO’s
Ø Businesses
Ø Community groups
Hazard Management cycle
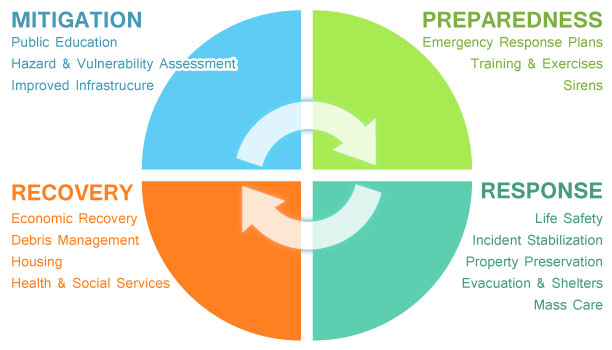
Hazard management cycle- explained
Mitigation
- Occurs before & after events
- = identifying potential hazards and reducing their impact
Preparedness
- Occurs before event
- = prep for response to and recovery from event
Response
- Occurs during/immediately after event
- = coping with hazard event
Recovery
- Occurs after event
- =short-term recovery, meeting immediate needs
Disaster trends
Total no. of disasters reported dramatically risen= better tech e.g monitoring & recording events.
Amount killed globally by disasters= falling
- Better early warning systems
- Improved building codes & disaster preparedness
- Overall cost of disasters rising from $20bill/yr to $100bill/yr between 2000-2010
Data usually incomplete as:
- when disaster strikes immediate effort= rescue NOT data collection
- no single organisation responsible, methods vary
- Differences in definition and key terms/categories used= misunderstandings
- Difficult to gather data from remote areas, under-reporting of death (places that require help and data)
Hazard profiles
= diagram that shows main characteristics of tectonic events- help governments and other organisations to develop effective management strategies.
Potential profile factors:
Magnitude/ Speed of onset/ Duration/ Areal extent/ Spatial predictability/ Frequency
Hazard profiles- examples
Indian Ocean tsunami
- High magnitude
- Rapid onset
- Widespread extent
= organisations focus on making sure early warning systems are at reach in all countries that might be affected
Kilauea
- Small
- Slow
- Limited extent, predictable & common
= government focus on developing evacuation plans
Park-Hazard Response Curve
= theoretical model showing how a city/country/region may respond after a natural disaster. Can be used to compare responses to different events or in different places.

Park-Hazard Response Curve- explained
Stage 1= shows quality of life at normal eqm level
Stage 2= where hazard occurs
Stage 3= event has occurred, search & rescue underway. Quality of life drops at this stage and stays low for hours or days depending on severity and development of region.
Stage 4= relief strategies underway, takes variable amounts of time- hours, days, weeks or months to reach this stage, but quality of life is improving.
Stage 5= long-term human response, rebuilding and restoring normality. Quality of life returns to normal, in some cases it can be higher than it was originally with repairs of old infrastructures. However, in some cases such as Haiti it does not return completely to normal.
Related discussions on The Student Room
- Eduqas A-level Geography Component 1 (A110U10-1) - 17th May 2023 [Exam Chat] »
- Edexcel A level Geography (2016) Notes »
- geography a level question »
- Is CGP good for A level? »
- can someone offer feedback on my 12 marker? Geog A level edexcel »
- Edexcel A-Level Geography Paper 1 | [17th May 2023] Exam Chat »
- the problem of evil »
- geography a level paper 1 CAIE »
- geography natural hazards »
- OCR A Level Geography Geographical debates H481/03 - 17 Jun 2022 [Exam Chat] »
Comments
No comments have yet been made