Introduction to Economics Sept 2017

?
  • Created by: AlexK03
  • Created on: 13-02-18 08:20

Factors of production

Resources- to make our wants and needs but are limited, i.e. fossil fuels & oil, (scarce)

Labour- Human input in production process ( not all human capital have the same skills, experience & education )

Lands-includes actual land and the resources surrounding it I.E; Sea, rivers, oil. 

CapitalGoods that are used to produce other goods and services, I.E; factories machinary. this is MAN MADE ONLY!

Enterprisepeople who take risks are known as entrepreneurs & take risk by creating things from the other three factors of production. I.E. if business fails then money is lost but if business is successsful then the reward is profit 

  • Basic example of each factor;

Labour- Fast food worker, Bin men/women, teacher etc etc. 

Land- Wood, cotton, wood etc. 

Capital- Washing machine, pencil case, table etc. 

Enterprise- Business man/ woman, Restaurant manager etc. 

1 of 9

Economic agents

The three econmic agents in the economy are; Producers, goverments, consumers. 

Producers:

  • Firms or people that make goods or may provide services
  • Decide how much to make & to sell it for
  • Need to think about what to produce, and what is most cost effective wya to increase the profit margins
  • Business failure would be blockbusters as they didn't listen to customers to go online and Netflix overtook their customers. 

Consumers

  • People or firms that buy goods and services 
  • Can be a firm which needs to buy products to make final product i.e. machines or ingrediants 
  • Decide what they want to buy and at what price, as they are buying the product 

Goverments 

  • Sets rules that the customers and producers have to follow 
  • Have to decide how much to get involved 
  • I.E. laws that make sure the producer is advertising the correct weight and ingrediants on food.
2 of 9

Markets 1

Markets- where buyers & sellers come together and exchange goods and services- doesn't mean face to face. 

Planned economy:

  • How the goveremnt allocates resources
  • Not market & this is rare 
  • North Korea is an example of planned economy 

Free market/ market economy 

  • Allocate resources based on supply and  price mechanism
  • Private mechanism- will sell for any price anyone is willing to pay 
  • By private individuals and firms 

Mixed Economy 

  • Combine free market and goverment intervention 
  • Privately owned business makes up the private sector, whereas the goveremnt is public sector
  • Work together to allocate resources, and the goverment has intervention/ biggest say 
  • Mixed economy has public and private sectors 
3 of 9

Markets 2

Advanatges of free market; 

  • Tax not having to be paid 
  • people have more disposable income to spend on businesses
  • producers don't have to spend lots of money of safety regulations 
  • no restirctions 

disadvantage of free market;

  • competition between compnaies will occur 
  • workers aren't paid minimum wage, struggle to buy essential items ( needs )
  • possibility of dangerous chemicals, (carcinogenic items) 
  • workers in dangerous conditions 

Entrepreneurship- reward for good ideas and encourages risk taking 

Choice- risk taking leads to better choice so the consumer has no restrictions 

4 of 9

The demand curve

Demand- is the amount of a product that comsumers and customers are  willing to pay and are able to buy at that specific point in time.            

Image result for demand curve economics (http://www.amosweb.com/images/MkDm33.gif)If the demand curve moves to the right = increase and left = decreae

  • As the price increase the quantity demand then decreases, but if the price decreases the quantity demand increase,  inverse relationship 

Contraction- Demand decreases due to price increase     Extension- demand increase due to price decrease


5 of 9

PASIFIC

  • Populationthe amount of people present if a country ( if the business isn't E-commerce ) will affect if the business will stay alive due to the profit 
  • AdvertismentThe increase in advertisement will create awarness which will inturn cause the demand curve to shift to move outwards ( right ) 
  • Substitute-priceNot the same product but the same end product
  • IncomeThe average income falling ( recession i.e. Uk 2008 ), will affect demand and make normal goods fall, and inferior good dmeand increase 
  • Fashion and trendstastes are constantly changing, I.e. Beauty and clothing stores, so for them to stay alive they needs rapid changing stock, for example: seasonal clothing. 
  • Interest ratesBorrowing goes up and items that require a loan means that the demandwill go up 
  • Complimentsa 'good' bought along side another 'good' for example fish and chips. 

This is a acronym for PASIFICwhich causes a shift in the demand  curve 

6 of 9

Types of goods

Normal  goods:

  • If prices increase then demand will decrease 
  • if prices decreases then demand will then increase 
  • Most goods and services are then classes as normal goods 

Consumer income:

  • General rule- as income increases demand increase vice versa 
  • Most disposable income lead to increase spending 
  • Luxary goods- are likely to have demand fall quicker if income falls
  • Necessity items- will see little to no change in income falls, but inferior shops like Aldi & Lidl will see a larger demand 

Normal goods= Heinz, Walkers crisps

inferior= ASDA smart price stock. 

7 of 9

Contraction and Extension diagram & info

Image result for contraction of demand graph (http://www.dineshbakshi.com/images/stories/economics_diagrams/ext_cont_of_demand_small.gif)

TO GET FULL MARKS YOU MUST LABEL AND PUT THE CORRECT ARROW: 

  • UP FOR CONTRACTION
  • DOWN FOR EXTENSION 
  • AND IF THE DEMAND CURVE IS EITHER CONTRACTION/ EXTENSION DRAW ONLY ONE DEMAND CURVE LINE AND ON ARROW. 
8 of 9

Left shift & Right shift Diagram and Info

Image result for left shift AND RIGHT SHIFT in demand curve

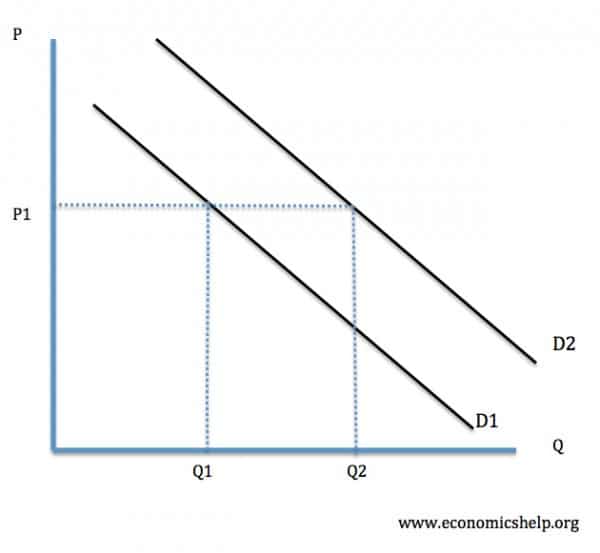
You must label the graph and each deamnd curve line with D1 or D2 depending on whether it's right or left shift 

D1 = the original demand curve 

D2= the current demand curve

in the diagram above this is right shift as the outer line = right shift and the inner line = left shift 

9 of 9

Comments

No comments have yet been made

Similar Economics resources:

See all Economics resources »See all Factors of production resources »