Economics- Macro
- Created by: James Hendrie
- Created on: 18-04-17 09:25
Fiscal Policy
Fiscal Policy involves the manipulation of government spending, taxation and the budget balence.
Fiscal can have both Micro and Macro economic functions.
Examples of Fiscal Policy:
- VAT
- Income tax
- Corporation tax
- NHS and education
Fiscal Policy-Aggregate demand
How Fiscal Policy can be used to influence aggregate demand.
Contractionary fiscal Policy aims to decrease aggregate demand. To do this the government will reduce spending or increase taxes. They would do this to combat inflation.

Fiscal Policy-Aggregate demand
How Fiscal Policy can be used to influence aggregate demand
Expansionary fiscal policy aims to increase aggregate demand. To do this government will increase spending or reduce taxes. they would do this to combat low GDP.

Fiscal Policy-Aggregate supply
How can fiscal policy be used to influence aggregate supply
- The government could reduce income tax to encourage spending and investment
- The government could subsidies training or spend more on education, this lowers cost for firms
- Spending more on healthcare helps improve the quality of labour workforce, and contributes to higher product
Fiscal policy-Taxes
Difference between indirect and direct taxes
- Direct taxes are imposed on income and are paid directly from the government to the tax payer
- Indirect taxes are imposed on expenditure goods and services and they increase production cost for producers. this increases market price and demand contracts.
Progressive, proportional and regressive taxes
- A proportional tax has a fixed rate for all tax payers, regardless of income. EG, flat income tax.
- A progressive taz has an increase in the avergae rate of tax as income increases, the proportion of income tax increases.
Fiscal policy-Limitations
Limitations of fiscal policy
- Governments may have inperfect information about the economy it could lead to inefficient spending
- Fiscal could take months/ years to have any lasting effects
The government can manipulatr the spending, taxation and government borrowing to influence the level of economic activity.
Fiscal policy-Examples
Fiscal Policy examples
- Pensions
- VAT
- Minimum wage
- Transport spending
- Income
- Healthcare
- Subsidies
- Corporation Tax
Fiscal policy-Goals
Fiscal policy Goals
- Inflation on target at 2%
- Stimulate economic growth
- Surplus on the balence of payments record of trade
- Low unemployment
Fiscal Policy- Expansionary/Contractionary
Increase GDP:
Example 1: Increase governement spending
Example 2: Cut income taxes USA 2010
Example 2: Subsideis to firms
Decrease GDP:
Example 1: Cut public spending in schools
Example 2: Increase in VAT
Example 3: Increase income tax
Cross Elasticity of Demand
Cross elastcity of demand- Measures the responciveness of demand for one good,X, to a change in the price of another good,Y.
Substitutes-Goods such as brands of cereal. an increase in the price of one good can lead to an increase to the demand of the other.
Price of Pepsi increases
Demand for Coke increases
Cross Elasticity of Demand
Firms who attemt to change the cross elasticity of thier product
- Substitutes-make products different/better
- Through branding so consumers are less likely to switch
- A firm will make close substitues
- Compliments
- Firms produce a range of compliments
Monetary Policy
Monetary Policy- Used to contorl the money flow of the economy, done with intrestrates and quantative easing
Quantative easing-Creates new money electronically to buy financial assets, like government bonds. this process ain to directly increase private sector spending in the economy.
The bank of England takes action to influence the intrest rates
The bank of england control the monetary policy
Monetary Policy- Instruments
Intrest rates
-MPC, monetary policy comitee- they alter the intrest rates to control the supply of money
-Every month, 9 members come together to discuss what the rate of intrest should be
-Intrest rates are used to meet government target of price stability, it alters the cost of reward savings
Interest rates
-The bank sets the base rates which which controls intrest across the economy
- If intrest rates are high this emans the reward of saving is high and the cost of borrowing is higher.
- This causes consumers to save more and spend less, this is used during high periods of inflation
- When intrest rates are low, the reward of saving is low and the cost or borrowing is low.
- This causes consumers to borrow more and means they are more likely to spend. This is used to stimulate economic growth
Balance of Payments
Important of Internatioal trade for an economy
- Materials: Countries are interdependant on each other the UK will buy certain goods from India because of hgh quality
- Increase market potential: If a firm would only be allowed to trade domestically it would limit market potential
- Prodcution costs: By trading in other countries, the company opens itself up to lower production cost for example its cheaper to produce cloths in bangladesh.
The Balance of payments
The current account: The balence of payments is the difference in total value between payments into and out of account, over a period of time.
The current account on the balnce of payments measures the in flow and out flow of goods, service and investment incomes
- Trade in goods
- Trade in service
- Investment and empolyment incomes
- transfers- Secondary income
Inflation and exchange rates
- If UK inflation is higher
- UK goods will rise faster
- Experts will fall
- less demand for british pound
- Pound value will fall
- Imported goods will be more expencive
- UK goods will be cheaper abroad
- manurfacturing maintain high prices
Hyper Inflation
- when the rule of inflation 50%
- 100 billion dollar notes were made
- Inflation reached 79.6 billion percent
Pros of inflation
- More exports
- economic growth
Cons of inflation
- Money is worthless
- Creates an unstable economy
Deflation
Deflation: A contine fall in the average price level overtime
A contraction in the supply of money in an economy leading to higher purchasing power of consumers caused by falling demand, fall in the suplly of money or higher intrest rates.
Measures of inflation:
- Consumer Price Index- Official measure of inflation calculates the average basket of goods and services.
- Retail Price Index- RPI is no longer in use but involved factors such as morgage payments, council and other costs.
- Basket Of Goods- A fixed set of consumer goods on an annual basis to measure inflation
Inflation
Inflation: The general level of price increase over a period of time
It means the cost of living increases and purchasing power decreases
Government target is 2%
Cost Push Inflation:
- Prices rise due to higher costs of production and more expencive raw materials. Its determined by supply factors
- Increase in Commodity prices, Labour cost higher taxes.
Cost Push Inflation
Demand Pull Inflation
Demand Pull Inflation: Prices increase due to strong consumer demand. If more people are buying goods and the average price level will increase. This is economic growth.

Employment and Unemployment
Unemployment: The number of people looking for work but cannot find a job at a point in time
Cyclical Unemployment: When a change in aggergaet demand means some people workers will be made redundant.
Frictional Unemployment: This occurs when workers move between jobs, mainly through career move or geographic changes.
Strucutal Unemployment: This occurs when cetain industries decline causing people to not have skills to work elsewhere
Measuring Unemployment
Measuring Unemployment
Claimant Count: Numner of people claming job seekers allownace
Labour force survey: Q uarterly Survey of approximatley 60,000 households compiled by the office of national statistics studying the employment circumstaces of the UK population
Problems with claimant count:
- Self empolyed workers who are temporaily unemployed tend not to claim
- Some people who claim JSA arent actively seeking work
- some jobs are in the black economy but continue to claim benefits
Employment and Unemployment
Labour force benefits
- Internationally recognised
- potential for analysis of data
- Picks up trends in sectors
- Better guides for policy makers
- Generally accepted to be more accurate
Consequences of Unemployment
- Less tax reveune
- Unproductivity
- Lower growth
- low inflation
- more benefits gievn out
- Less aggergate demand
Economic Cycle
The economic cycle shows fluctuations in real GDP over time
Boom
- High productivity
- Pollution increase
- Low government deficit
- Low unemployment
- Inflation
- High HDI
Economic Cycle
Recessions
- Increase in umemployment
- Deflation/inflation increase
- Decrease in consumer confidence
- Increase in poverty
- Increase in government spending
- Decrease HDI
- High governement deficit
- decrease housing prices
Economic Cycle
Growth
- Decreaase Unemployment
- Inflation increases
- High HDI
- Increase inequality
- Increase pollution
- Decrease in government deficit
Determinents of short run aggergate supply
SRAS: when atleast one factor of production is fixwd
LRAS: when all factord of production are variable
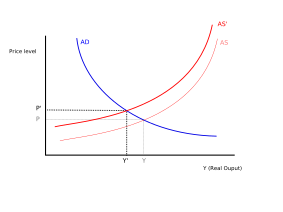
Supply Curve

As prices rise, supply increases therefore aggergate demand increases
Factors affecting aggregate supply
Changes in factors of production
- Change in price level of raw materials
- Improved technology
- Change in minimum wage
- Subsidies
- Economic growth
- level of unemployment
- Decreases in taxes
- Reduction of red tape
SRAS curve

Movements along the supply curve
- Fall in price level/ contraction
- Increase in price level/ expansion
Determinants of long run aggregate supply
LRAS curves vertically becuase change in aggregate demand can change total output
The line represents the maxiumum level of output so the line is vertical
Determinants of long run aggregate supply
Factors the impact LRAS:
- Increase in productivity
- Increase ij labour market participation
- Innovation and enterprise
- Capital Investment
- Rate of growth
- Change in productivity, chnage in stock of capital and labour resources
Policies to increase LRAS
- Labour supply increases
- Incentives/ healthcare population
- Improved mobility of labour
- Structural and occupational labour
- productivity increases and competition increases
Economic Growth
Short run: The actual annual percentage change in real natioal output/ real GDP
Long run: An increase in the potential productive capacity of the economy
Causes of short run economic growth
- Fall in comedity prices
- change in minimum wage
- subsidies
- change in the cost of production
Causes of short run economic growth
- Immigration
- investmentin infrastructure
- New technology
- Innovation
Evaluating Economic growth
Pros
- Low unemployment
- High GDP
- More tax
Cons
- Effects the environment
- High inflation
- stroner exchange rates
Aggregate demand
Government+ consumption+ Investment+ (Exports-Imports)
The higher the level of economic activity, the higher the level of aggregate deamnd.
Any increase in G+I+G+(X-M) will shift the curve to the right
The multiplier effect: Occurs when a inital injection into the economy or circular flow of income causes a larger final increase in the level of real national income/output
Government pay teachers £1 billion to improve pay
Teachers will spend 80% leading to a consumption increase
Aggregate demand and the level of economic activit
Economic activity: Production and consumption of goods and services in the country
The Multiplier Process:
- The mulitplier is the relatiohsip between aggregate demand and the resulting, ususally larger change, in income.
- Increase in governement spending by £10 billion will increase peoples incomes.
- It is likely everyone saves a small fraction and spends the rest leading to further smaller succsessive income rises
- this will happen until the increase is so small it can be ignored
- The proocess can work in reverse
- The multiplier process is dynamic
- This is because i affects all areas of the market overtime
Multiplier process
Mulitplier= Change in national income = Change in income
Initial chnage in government Chage in consumption
spending
Fiscal Multipiers
- Government spending
- Tax
Trade Mulitpiers
- Expoprts
- Imports
Aggregate demand and the level of economic activit
Capital investment
- Technology
- Technology advances enhance the need to invest in capital. a new technology requires new capital
- Capital Prices- If capitlal prices increase, employment will increase
- Government spending
- Fiscal Policy- If aggreagte demand decreases because of less spending from the household or business sector
- Balence of payments
- A number of things can influnce the balence of payments contributing to aggregate demand
- Exchange rates is the price of one nations currency in terms of another. whens this rate changes, it affects prices of all imports and exports
Aggregate demand and aggregate supply analysis
Total demand of scarce resources in the economy is aggregate demand
AD= Consumption+ Investment+ Government+ (Exports- Imports)
Factors that affect AD
- A large rise or fall in the exchange rate
- A recession
- A slump in the hosuing market
- Credit crunch
- Unexpected rise or fall in intrest rates
- Falling real incomes
- The balence of trade
Aggregate demand
Fall in AD
- Fall in net exports
- cut in government spending
- Higher intrest rates
- Decline in housholds wealth and confidence
- Demand side policies
Increase in AD
- Depreication of the exchange rate
- Cut in direct and indirect taxes
- Increase in house prices
- Expansions of supply of credit + lower intrests
Demand side policies
Demand side policies
- Monetary policy
- If the central bank cut intrest rates more pople would borrow money encouraging investment and consumption
- Quantitative easing
- This involoves increasing the money supply and so the the the exchange rate is low
- Fiscal Policy
- The government can boost demand by cutting tax and increasing government spending
Aggregate supply
Aggregate supply: Is the total amount of goods and services supplied by an economy firms over a period of time
Components of AS are
- Consumer goods
- Capital goods
- Public and merit goods
- Traded goods
Supply side polices
Factors the affect Aggregate supply: factors that change the prices of a firm
- Taxes
- Subsides
- Wages
- Price of raw materials
Supply side Policies
- Lower inflation
- Lower unemplyment
- Improved economic growth
- Improved trade and balence of payments
Circular flow of income
National Income- Total value of a countries final output of all new good and services produced in one year
Nominal income- Is not ajusted to the rate of inflation
National output- Measures the actual amount of incoome recieved my labour and capital
An injection- I s when money which enters the economy. This is usually in the form of governement spending and exports
Circular flow of income model

Uses of Index numbers
Index Numbers are values expressed as a percentage of a single base figure
102 = 2% Inflation
98 = 2% Deflation
- Base Index numbers of 100
- Used to forecast economc trends, can be used to dtermine exchage rates
- Wieghting- Used to show to relative importance of individual items in our findings
Added items
- Livestreaming/ Netflix
- Visas
- Uber
- Portable chargers
Macroeconomic Indicators
GDP- Gross domestic Product
Nominal GDP- Doesnt take inflation into account
Real GDP- Shows actual growth in the economy
GDP per capita = GDP/ Population
High GDP per capita
- Luxemborg- 111,162
- Norway- 100,819
- Quatar- 93,352
Low GDP per capita
- Malawi- 252
- Central African Rebulic- 382
Macroeconomic Indicators
CPI- Consumer, Price index
Average basket of goods
- Milk
- Bread
- Beans
- Rice
- TV
- DVD player
- Goods and services
Macroeconomic Indicators
Unemployment- Those who are fit and willing and able to workbut cant find work
Claimant Count- The number of people claiming job seekers allowance
Labour force survey- A survey of around 60,000 houses complied by the office of national statistics studying the employment circumstances of the UK population
Balence of Payments
Deficits = Imports > exports
The Objective of Government Economic policy
Main Governement objectives
- economic growth
- Price stability
- Minimising Unemployment
- Stable balence of payments
Economic Growth
- Measures the rate of change of a countries output
Top GDP countries
- USA
- China
- Japan
The Objective of Government Economic policy
Consequences of economic growth
- High Inflation
- Environmental issues
- Low unemployment
- High HDI
- More investment
- Surplus in Balence of payments
- Increased Prices
The Objective of Government Economic policy
Unemployment
- Those who are willing and able to work, who cant find work
- Unemployment is a major problem becuase it a waste of resources
- High unemployment is a generally an indicator of poor economic preformance
- Economies that have strong economic growth are likely to hacve low unemployment
Government policies to reduce unemployment
- Reduce Benefits
- Increase Number of low skilled jobs
- Inc rease Minimum wage
- Subsideis firms to locate
The Objective of Government Economic policy
Benefit of low unemplyment
- Reduced poverty
- Higher incomes
- Iproved standard of living
- Higher tax revenue for government
- Lower government spending on unemployment related to welfare
Inflation
- Increasing prices
- average basket of goods
- Inflation stable at 2 %
Related discussions on The Student Room
- economics - macro »
- GES (government economic service) placement year interview? »
- AQA A Level Economics Paper 2 (7136/2) -22th May 2023 [Exam Chat] »
- A Level Edexcel Economics B Paper 2 (9EB0 02) 2023 [exam chat] »
- Edexcel A Level Economics A Paper 3 (9ECO 03) - 5th June 2023 [Exam Chat] »
- Explain Liss truss policies to me »
- 5 months till alevel exams can i still get AAA »
- 25 Marker »
- When will the next General election be ? »
- Fiscal policy - GCSE Economics »
Comments
No comments have yet been made