CORE PHYSICAL CASE STUDIES
- Created by: Frances
- Created on: 26-04-18 21:29
FLOODING IN PAKISTAN (INDUS RIVER BASIN)
Pakistan has a long history of flooding. Between 1950 and 2010, floods in the Indus river basin have killed a total of 8 887 people, affected 109 822 villages, and caused a cumulative direct economic loss of about $19 billion.
Impacts of the 2010 flood
The 2010 flood, which affected all the provinces and regions of Pakistan, killed 1600 people, caused damage totalling over $10 billion, and inundated an area of about 38 600 km2. This flood was Pakistan's most damaging on record. In the country as a whole, the floods damaged nearly 2 million houses and displaced a population of over 20 million.
Flood damage occurred mainly in the agriculture and livestock sector (50 per cent lost), followed by housing (16 per cent) and transport and communications (13 per cent). The prolonged inundation of large areas of cultivated land resulted in massive losses in the agriculture sector. Forecasts estimated that Pakistan's GDP growth rate of 4 per cent prior to the floods could turn to minus 2 % to minus 5 % followed by several additional years of below-trend growth.
FLOODING IN PAKISTAN (INDUS RIVER BASIN)
Crop losses were not just in vegetables and cereals but in crops such as cotton that supplied textile manufacturing, Pakistan's largest export sector. There was also the loss of over 10 million heads of livestock which, along with the loss of arable crops, reduced agricultural production by more than 15 per cent. As milk supplies fell by 15 per cent, the price of milk increased by 5 US cents per litre.
Manufacturing companies, such as Toyota and Unilever Pakistan, had to make cuts in production, as infrastructure such as roads and bridges were destroyed and damaged.
In September 2010, the International Labour Organisation reported that the floods had costmore than 5.3 million jobs. The province of Sindh in the south of Pakistan was most badly affected - about 1 million houses were damaged and of these, 66 per cent were completely demolished, while the remaining damaged houses were often no longer habitable. There was also extensive damage to schools, roads and bridges, telephone lines and electric supply lines
FLOODING IN PAKISTAN (INDUS RIVER BASIN) - CAUSES
Flooding in Pakistan has generally been caused by the heavy concentrated rain received in the monsoon season in the months of July and August. However, the 2010 floods were a combination of natural and human factors that produced flood peaks that were far in excess of the river channels capacity to hold them.
The natural factors included: The monsoon rainfall in July 2010 was exceptional - some areas in Northern Pakistan received more than three times their annual rainfall in a matter of 36 hours. These abnormal monsoon rains amounted to double the 50-year average annual rainfall. A steep topography in the upper basin produced rapid overland flow/ surface runoff
The human factors included: The Indus basin lacks an appropriate flood policy and has an inadequate flood-control infrastructure. Lack of protective vegetation due to river basin developments increased runoff into river channels. Deforestation in the upper catchment was a major factor.
Poor anticipation of the scale of the flood - it was known in advance by a couple of days that around 4-10 km3 of water would pass through the Taunsa, Guddu and Sukkur dams, but no measures were taken to mitigate the effects of these huge volumes of floodwater downstream from the dams.
FLOODING IN PAKISTAN - FLOOD MITIGATION MEASURES
The Government of Pakistan has been relying on a traditional flood control approach based on structural, hard engineering measures, through the building of dams and building of artificial levees. Between 1950-2010 the government spent $1.2 billion repairing flood damage, developing a flood-forecast system and building new levées. However the 2010 flood exposed weaknesses in these systems.
The Pakistani government does not have an approved water policy, but there is a draft National Water Policy that recognises the need - for appropriate flood management. This includes:
The continued construction of flood-protection facilities and the maintenance of existing infrastructure
Reviewing the design and maintenance standards of existing flood protection structures
The establishment and promotion of flood zoning, and the enforcement of appropriate land uses in flood threatened areas and Strict reservoir operating rules, The effective use of non-structural measures and The creation of flood response plans
FLOODING IN PAKISTAN - STRUCTURAL MEASURES
- 6000 km of levées provide the bulk of flood protection. The levées now cover most of the critical stretches along the river channels and are the main flood-protection infrastructure. The height of these levées remains arbitrarily fixed at 1.8 meters (6 feet), which is higher than the previously observed peak flood levels in the basin. However, due to changes in channel shape the channel capacity at any location may change and require higher levées. Channel shape monitoring is needed to accurately determine the optimal levée height at different locations. The remote location and the inadequate maintenance of many levées has proved to be a major challenge.
- 1410 spurs (these are stone walls constructed transversely or obliquely to the flow direction to divert flooding at critical locations) that have been built since 1960 to protect the main towns and important infrastructure, such as major roads and railways.
- The 2010 flood demonstrated the effectiveness of the country's two main reservoirs at Mangla and Tarbela. However, sedimentation in both has significantly reduced their storage capacities. Pakistan currently has a water storage capacity equal to about 30 days of mean annual discharge, and this water is mostly used for irrigation and energy generation.
FLOODING IN PAKISTAN - NON-STRUCTURAL MEASURES
Pakistan is looking to improve its flood forecast and early flood warning systems. At present it does not cover the whole Indus river basin.
The Indus is a trans-boundary river - parts of its catchment are in neighbouring countries.
Currently, cooperation with these neighbouring countries is limited so that key information regarding precipitation input and river discharge from the important upper areas of the catchment is both insufficient and delayed
ROCKS AND WEATHERING - SOUTHERN BRAZIL
From 1900-2015 there were 22 major landslide ants in Brazil, killing 1641 people, affecting 24 million people and causing $86 million worth of damage to property and infrastructure. The majority of these events were in the coastal mountains of mid-southern Brazil. During the Southern Hemisphere summer season of December to March, the combination of steep slopes, heavy rainfall, residual soils, and weathered rocks have made the coastal mountains of mid-southern Brazil particularly susceptible to major, catastrophic landslide activity. In January 2011 a massive landslide in the mountainous Serrana region of the state of Rio de Janeiro left over 900 people dead and 18000 homeless. 300 mm of rainfall within 24 hours triggered many landslides. In the worst incident, more than 200 people were buried alive when the Morro do Bumba favela collapsed.
The region has become more vulnerable due to unchecked deforestation turning steep slopes into dangerous landslide-prone areas. Illegally occupied hillsides, with poor foundation quality and the physical expansion of urban areas by rapid population growth has also contributed to the increased vulnerability of the residents in the region. This disaster caused millions of dollars in damage. Apart from the destruction of infrastructure, local authorities also had to spend millions on the provision of temporary housing.
ROCKS AND WEATHERING - SOUTHERN BRAZIL
Responses to the landslides
The Brazilian national and urban authorities have designed short and long-terms solutions to deal with the disaster.
In the short-term, the urban authority gave affected families shelter for up to six months and the federal government offered to pay the rent of 2500 families for an indeterminate period, set up a centre to register missing persons, and relocated families to better organise shelters in churches, warehouses, and stadiums.
In the medium and long-terms, the federal 4 government allocated $460 million for reconstruction funds and promised to remove bureaucratic bottlenecks, register people to help with long-term housing needs, map out and evacuate risk-areas where residents are holding on to their homes, and review the current procedure of cleaning up disasters rather than stopping them from happening - being pro-active rather than reactive, and to prioritise prevention by controlling urban expansion pressures and natural resource exploitation, especially in areas characterised by mountainous topography.
ROCKS AND WEATHERING - SOUTHERN BRAZIL
Rio de Janeiro has put into operation a landslide early warning system “Alerta-Rio" dividing the urban area, for warning purposes, into four alert zones. Alerta-Rio has two different alerts: rainfall warnings and landslide warnings. Other responses by the government include mapping geological risk areas, identification of support facilities (places to serve as temporary shelter during heavy rains, usually churches, schools, kindergartens, etc.), and of safer routes towards them, as well as points for the installation of sound alarms (horns or sirens).
HYDROLOGY - THE THREE GORGES DAM
Downstream of the city of Chongqing, the Chang Jiang flows through a deep, narrow section of its valley known as the 'Three gorges’.This is an ideal site for a dam because the reservoir is very big but is contained in the narrow valley and does not spread out over a huge lowland area. The dam has been built at Sandouping and the reservoir is 660 km long and 1 km wide, extending upstream almost as far as Chongqing.
The Three Gorges dam is the largest hard engineering project ever undertaken on a river. Construction started in 1994 and the dam was completed in 2006. The project was finally completed in 2009 when the reservoir completely filled up. The dam is 2.3 km long and almost 200 metres high. A series of gigantic ship locks has been built at the north-east end of the dam and an 18 000 megawatt H.E.P. station has been built inside the southwest end of the dam. It has cost in inside the southwest end of the | excess of US$ 38 billion to build.
HYDROLOGY - THE THREE GORGES DAM
What are the benefits of the scheme?
• At least 50 million people have been protected from the sort of catastrophic flooding that occurred in 1998, including those living in the mega-cities of Wuhan and Shanghai.
Millions of hectares of farmland have been protected from flooding and provided with guaranteed irrigation water. This will raise grain and oil-seed production.
• Over 1000 cultural and archaeological sites have been flooded, including the Zhang Fei temple.
Water supplies to the 13 million people living in Shanghai are now secure.
• It is generating 10 per cent of China's electricity equivalent to 15 nuclear power stations. This is clean HEP and its production will not contribute to air pollution or to climate change. The power produced will boost economic growth, especially in central and eastern China, including the cities of Wuhan and Shanghai.
. The Chang Jiang is now navigable by ships of up to 10000 tonnes, as far upstream as Chongqing. There is expected to be a 500 per cent increase in river traffic and this will also boost economic growth.
HYDROLOGY - THE THREE GORGES DAM
What are the disadvantages of the scheme?
The reservoir has flooded 150 towns and cities and 1300 villages. 1.2 million people have been resettled in new settlements close to their old homes but the compensation did not cover the cost of their new homes.
. The reservoir is heavily polluted by toxins from flooded mines and factories. This has damaged the river's fragile ecosystem and species such as the White Flag River Dolphin and the Siberian Crane are endangered.
• The landscape itself could be a problem. As the water seeps into the rocks of the steep valley sides, landslides are expected. This is also an earthquake region and if the dam were to break the resulting flood would be unbelievably devastating.
• The Chang Jiang is laden with silt. This will be deposited in the reservoir, reducing its capacity. It will have to be dredged or flushed out on a regular basis. In the past, farmland downstream was fertilised with a thin layer of silt each year. This has been lost and more chemical fertilisers are needed.
HYDROLOGY - THE THREE GORGES DAM (AFFORESTATION)
Upstream of Chongqing, the Chang Jiang runs through a hilly area on the borders of Yunnan and Sichuan provinces. This used to be heavily forested but many of the trees were cut down in the 1960s for fuel, timber and farmland. The new fields are used to grow crops like buckwheat but the terraces are poor and soil erosion is a problem. Animals are grazed here too. There is a now a big programme to get the local people to replant the trees wherever possible. The advantages are:
• Trees encourage interception, evapotranspiration. This will help to reduce flooding, both locally and downstream. and infiltration.
• Forested areas have less soil erosion. This will be good for the local area and will reduce the amount of silt further down the river. This also reduces flooding and will reduce the rate of sedimentation in the Three Gorges reservoir.
• Trees can be harvested for food, fodder, fuel and timber.
However, the disadvantages are that the local farmers are losing their arable and grazing fields. Many of the trees planted are fast growing conifers which are less useful than the natural forest and do not stimulate biodiversity.
ATMOSPHERE AND WEATHER VANCOUVER'S MICRO CLIMATES
Vancouver, Canada's third largest city, is open to the sea but backed by mountains broken by the valley of the Fraser River, which enters the coastal lowland to the east of the city.
TEMPERATURES
ATMOSPHERE AND WEATHER - VANCOUVER'S MICRO CLIMATE
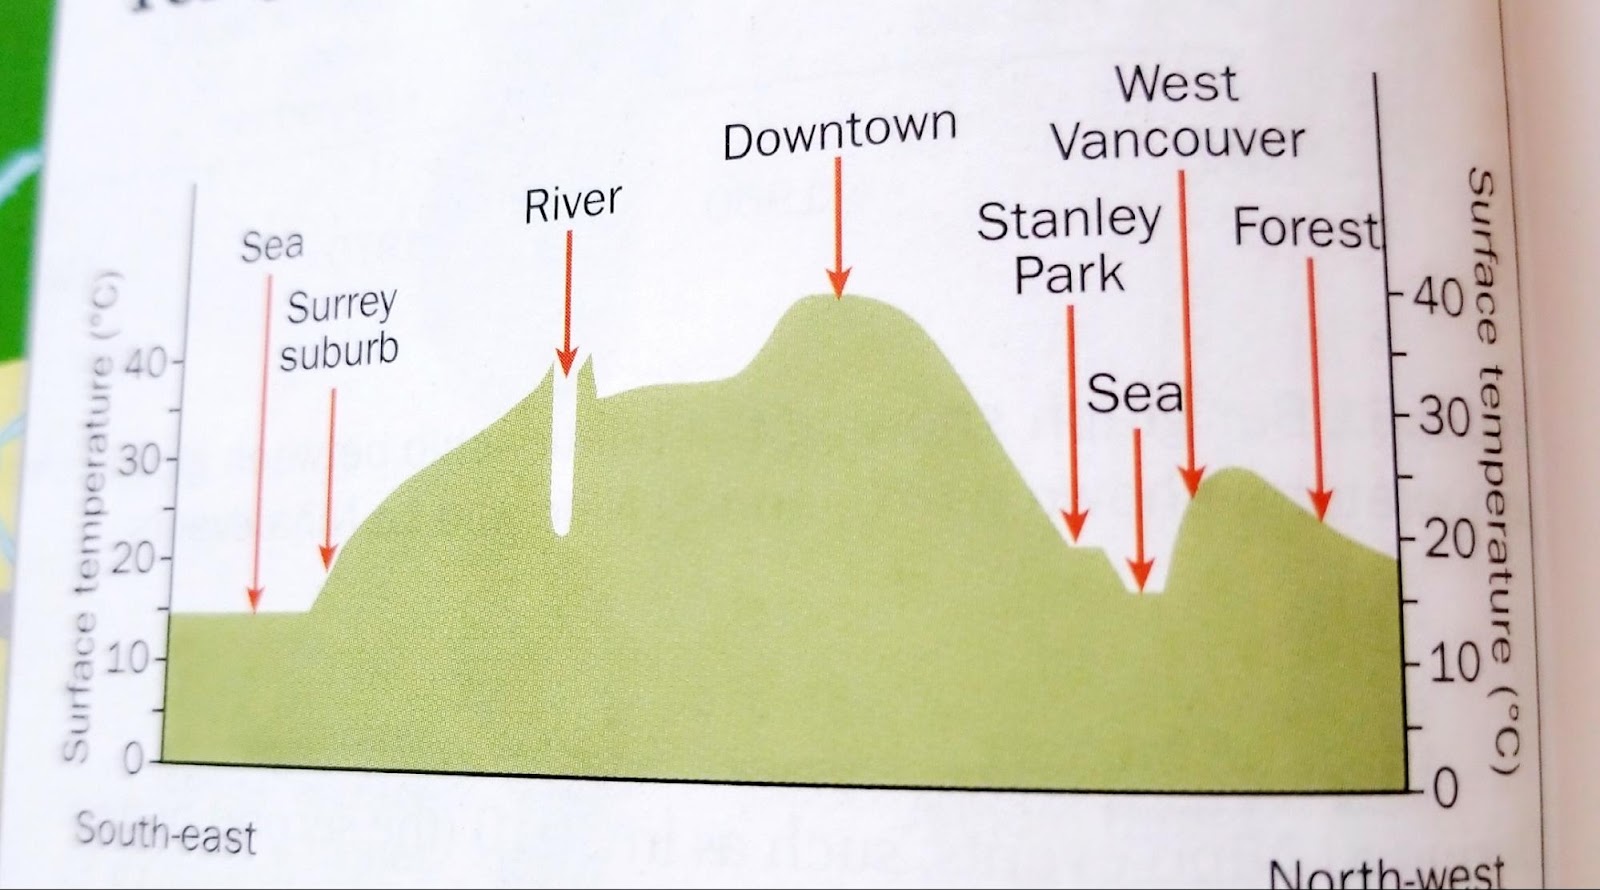
On sunny summer days a surface temperature traverse across the city shows a marked heat island. The sea has the lowest temperature, followed by the river. Stanley Park also has relatively cool temperatures, similar to those in the rural farmland of the Fraser Valley. The international airport is not shown on the diagram but would record a higher temperature than the well-vegetated Stanley Park because of the terminal buildings and runways. Temperatures are higher in the suburbs of West Vancouver and Surrey but the 'dome' of the heat island is centred on the downtown (CBD) area where there is a high density of skyscrapers.
When sea breezes blow on some summer afternoons, air temperatures near the coast can be 5-10°C cooler than in the Fraser Valley beyond their influence. whereas in winter it is the inland areas that are cooler, by about 2 °C.
The difference in temperature between urban and rural areas is also high on summer nights under calm and cloudless anticyclonic conditions when there are no winds to remove the heat. In those conditions, temperatures can decrease steadily outwards from 20°C in central Vancouver to 15°C at the international airport. All large urban areas have earlier springs, later autumns and fewer frosts than nearby rural areas.
ATMOSPHERE AND WEATHER - VANCOUVER'S MICRO CLIMATE
This heat island effect is caused by several factors:
• Brick, concrete and dark tarmac surfaces have a large specific heat capacity and low albedos. They rapidly absorb solar radiation by day, especially in summer. The heat is conducted away from the surface, stored and re-radiated steadily into the air at night as long-wave radiation.
Tall buildings turn streets into 'canyons', giving a reduced sky view and a smaller angle of direct heat loss at night. Large urban parks, such as Stanley Park, and open countryside are cooler because the sky is much wider', so radiational heat losses are greater. The greater the building density, the greater the heating, so city centres have the highest minimum temperatures at night and temperatures gradually cool through the more spacious suburbs to the countryside.Central heating, gas and electric fires, together with heat from industrial sources, all warm the urban atmosphere.
Although pollutant particles and gases (such as sulphur dioxide from the combustion of fossil fuels and carbon monoxide from vehicle exhausts) reduce the amount of short-wave radiation reaching the surface by day, their main effect is reducing the loss of re-radiated energy at night by absorbing and reradiating long-wave radiation.
ATMOSPHERE AND WEATHER - VANCOUVER'S MICRO CLIMATE
• Higher rates of evapotranspiration in rural areas lower their temperatures by absorbing heat.
Wind
Skyscrapers in the CBD can cause turbulence and vertical uplift with eddies in the lee of buildings, but winds are generally less strong in the city centre because the tall buildings obstruct and deflect airflow and increase friction. There are more calm days in the built-up area than in the surrounding countryside. However, canyon-like streets have the strongest gusts when winds are funnelled between their tall buildings.

ATMOSPHERE AND WEATHER - VANCOUVER'S MICRO CLIMATE
HUMIDITY
Absolute and relative humidity are both lower during the day in the city than in the rural area because less surface water and vegetation is present for evaporation and transpiration to occur. Rainfall runs off rapidly down gutters and drains. However, humidity rises over the harbour, Burrard Inlet and the Fraser River where more evaporation is possible. Daytime humidity is also greater over Stanley Park where moisture is increased by transpiration.
At night, humidity tends to be slightly higher over the city because in rural areas more dew is deposited from the air, making it less humid.
PRECIPITATION
An orographic effect is present as, for every increase in height of 100 metres within Vancouver, precipitation increases by about 100 mm. The mountain edge of West Vancouver receives double that of the main city. Snow falls there in winter but is rare in the lower areas, the parts of the city nearer the warmer ocean and in the central city, where the warmth melts most snow as it is falling.
ATMOSPHERE AND WEATHER - VANCOUVER'S MICRO CLIMATE
Relief is the most important cause of variations in rainfall within the city but the greater amount of cloud and precipitation also results from:
- the development of convection currents on calm, clear nights when the urban-rural temperature differences are largest. Warm air rises over the central city and the airflow moves towards the rural area aloft and then sinks. Meanwhile, air moves from the rural area over the surface to the lower pressure in the city. These convection currents result in higher rainfall in the central city, with more thunderstorms. It can be 10 per cent cloudier than in the surrounding rural area
- storm cells intensifying by contact with the warm surface as they pass over
- buildings forcing moist air to rise, triggering convection
- the increased density of hygroscopic (condensation) nuclei strongly encourages condensation.
ATMOSPHERE AND WEATHER - VANCOUVER'S MICRO CLIMATE
Fog and smog
Fogs are more frequent in the city, particularly in winter, because:
- lower wind speeds and more frequent calm period allow the air to remain in contact with the ground and to cool by conduction
- there are a greater number of hygroscopic nuclei (e.g. smoke and dust particles and sulphuric acid droplets) around which condensation can occur.
Cities have seven times as many particulates and up to 200 times more gaseous pollutants than surrounding rural areas. It has been estimated that 75 per cent of pollution in Vancouver is from motor vehicles. The lower Fraser Valley is affected by photochemical smog on warm summer days but the eastern suburbs have more ozone concentrations than the downtown area. This is because the chemical reactions that form ozone take time. Strong ultraviolet sunlight causes chemical reactions in the hydrocarbons and nitric oxides of exhaust fumes, creating surface level ozone, the ingredient of photochemical smog. It is gradually produced as sea breezes move the pollutants inland. Mountains to the north and east trap the pollutants in the eastern suburbs of Port Moody and Coquitlam.
ATMOSPHERE AND WEATHER - VANCOUVER'S MICRO CLIMATE
The worst pollution occurs during anticyclones because the subsiding air warms and causes a temperature inversion above the city, which acts as a lid on rising air and traps the pollutants below it. The light winds in anticyclones do not disperse the pollutants, so assist fog to form and mix with pollutants to form smog.
URBAN HEAT ISLAND - LOS ANGELES, CALIFORNIA, USA
The Los Angeles metropolitan area is the second largest metropolitan area, after New York, in the USA with a population of 18.2 million people. Its land area is 12562 km2, making it the largest in the United States.
In the 1930s, Los Angeles was nothing like it is today. It was covered by irrigated orchards with a high temperature of around 36 °C. However, as urbanisation took place, vegetation and trees were replaced with concrete and metal and the average temperature of Los Angeles increased steadily and reached 41°C, and higher, in the 1990s.
This highly populated urban region with its high density buildings, congested roads and booming economy has in influence on local climate:
-
Daytime temperatures may be on average 0.6°C higher than surrounding rural areas
-
Nighttime temperatures may be 3-4°C higher due to buildings radiating heat and the presence of increased cloud and dust reducing long-wave radiation output
URBAN HEAT ISLAND - LOS ANGELES, CALIFORNIA, USA
-
Mean winter temperatures may be 1-2 °C higher
-
Mean summer temperatures may be 5°C higher
-
Mean annual temperatures may be 0.5 to 1.5°C higher than the surrounding areas
The reasons for these differences include:
Urban heat island: buildings in urban areas absorb more radiation than vegetation. This is then re-radiated back to the atmosphere at night, raising temperatures and giving the urban heat island effect, which has an effect on the thermal profile of an urban area .
In a typical thermal profile of the UHI, the rural thermal field is interrupted by a steep temperature gradient at the rural/ urban boundaries. There is then an increasing temperature until the highest temperature point is reached in the urban core or city centre.The island-shaped pattern is not quite uniform with a few peaks and depressions due to the presence of particularly hot points (i.e. micro urban heat islands) associated with features such as car parks/parking lots, shopping malls, industrial facilities, etc, and cold points due to features such as parks, fields, water bodies such as lakes, ponds and rivers, etc.
URBAN HEAT ISLAND - LOS ANGELES, CALIFORNIA, USA
Temperature is not the only change - London receives approximately 270 fewer hours of sunlight than the surrounding countryside due to clouds and smog
Building materials are usually very good at insulating, or holding in heat. For example, concrete can hold roughly 2000 times as much heat as an equivalent volume of air. This insulation makes the areas around buildings warmer. Therefore, buildings in cities tend not to reflect heat but absorb it. The albedo of urban areas is also lower, allowing for the greater absorption of heat energy. The buildings become stores of heat, which can then be released during the night. In addition, there is less evaporation so less energy is needed for the evaporation process, making it more available in the form of heat.
Convectional activity: the higher temperatures and convectional heating may lead to an increased likelihood of thunderstorms and hail in urban areas.
Wind: buildings also provide increased friction with the wind which produces lower wind speeds – up to 30 per cent lower - than in rural areas. However, high-rise buildings and skyscrapers may channel winds and so increase wind speeds in the gaps between them.
CALIFORNIA AND LOS ANGELES - ROCKS AND WEATHERING
Slides and flows are common in California, damaging roads, railways, pipelines, electricity cables, and other infrastructure. The suburbs of Los Angeles are particularly affected.
The causes are as follows.
Intense rainfall
Downtown Los Angeles has an annual precipitation of only 385 mm, which mainly occurs during the winter and spring, with heavy rainfall during winter storms. The coast gets slightly less but the hilly suburbs get slightly more. However, there is great variation from year to year. Heavy rainfall on dry ground can lead to mudflows and loading of the ground resulting in landslides.
Soft, poorly-consolidated rocks
The geology of the area consists of relatively young Neogene and Pleistocene marine sediments deposited between 15 million and 1 million years ago.
CALIFORNIA AND LOS ANGELES - ROCKS AND WEATHERING
Steep relief : Los Angeles rises from sea level to 1547 m (Mount Lukens) in the form of a basin. The central parts of the city are flat but the outer suburbs are hilly, for example areas such as the San Fernando Valley, the Santa Monica Mountains, Mount Washington, Boyle Heights and San Pedro.
Road and housing construction: Los Angeles (population 3.88 million in 2013) has grown rapidly outwards into hilly districts prone to mass movements. Construction in these hilly districts can add load to unstable slopes and road cuttings in these areas may also be unstable.
Oil and water extraction: Groundwater extraction for water supply and petroleum extraction have both caused ground subsidence. In 1963 in the Baldwin Hills a dam collapsed as a result of this.
Earthquakes: The San Andreas fault system and other active faults in the area can trigger landslides on slopes affected by the factors listed above. Earthquakes can also cause liquefaction of the ground.
CALIFORNIA AND LOS ANGELES - ROCKS AND WEATHERING
Examples: Although slope failures are common in California, some of the most significant include:
- April 18, 1906. A major earthquake in San Francisco triggered numerous landslides, including the Devil's Slide in San Mateo County. The latter is still active today.
- January 3-5, 1982. Landslides in the San Francisco Bay area killed 25 people and caused at least 66 million USD in damage.
- January 10, 2005. A mudslide in La Conchita killed 10 people and destroyed 18 homes.
Mudflows in southern California, December 2010
In one week in December 2010 the area received half of its annual average rainfall and some streets flooded. California Governor, Arnold Schwarzenegger, declared a state of emergency for half a dozen communities and residents were evacuated and authorities put on alert for landslides and mudflows. Hundreds of people were evacuated in the suburbs of Los Angeles, with particular concerns for homes in steep-sided valleys previously affected by wildfires. The ground is so saturated it could move at any time', said Bob Spencer, spokesman for the Los Angeles County Department of Public Works.
CALIFORNIA AND LOS ANGELES - ROCKS AND WEATHERING
Mudflows in southern California, December 2010
Then heavy rains of up to 25 mm per hour caused a landslide on a heavily used section of Interstate 10 early on Wednesday, covering three lanes near the city of Pomona. In Highland District, 104 km east of Los Angeles, two rivers overflowed, swamping as many as 20 homes in mud. In Silverado Canyon, Orange County 25 to 30 people were evacuated from their mountain homes. This mudflow moved cars, picked them up, stood them up on their nose at 45-degree angles, buried them', said Bill Peters, a spokesman for the California Department of Forestry and Fire Protection.
Homes in the mountains were blocked by boulders and mud as rescue workers helped residents seek shelter. Officials ordered the evacuation of 232 homes at the bottom of large hillsides in La Canada Flintridge and La crescenta, in the suburbs of Los Angeles
CALIFORNIA AND LOS ANGELES - ROCKS AND WEATHERING
Attempts to reduce mass movement: The main method of reducing risk has been to produce maps that show past landslide features which are likely to be re-activated. This is done by the California Geological Survey. The maps indicate areas where the probability of liquefaction and earthquake-triggered landslides are significant enough to require a more detailed site evaluation prior to developments such as buildings or road construction. Before 1995 these site evaluations were voluntary but they are now a legal requirement.
A landslide inventory and related hazard zone maps are available on the California Geological Survey website. ne new landslide inventory maps cover 62 square ve areas known as 'quadrangles', including parts of bank, Universal City, Beverly Hills, West Hollywood, Culver City and Glendale, as well as communities of Baldwin Hills and nearby View Park.
Systems such as rock bolts, netting and shotcrete are not appropriate for stabilising slopes in the soft, poorly consolidated rocks which form many of the slopes.Slope failures still happen frequently outside the built up area but the system is focused on reducing the risk to property and human life where slope failures are the result of human activity.
It is difficult to produce hard statistics to evaluate the success of the system but there is little doubt that it will have had a significant effect.
Related discussions on The Student Room
- Can I go into biochem or work in the medical field with these alevels? »
- Do I need maths for architecture? »
- Maths vs Maths and Physics »
- What is necessary for me to study to sit for STEP exam? »
- Can you do Product design / engineering without Maths and Physics ? »
- GCSE Options »
- Geology without science »
- Required practicals chemistry A level »
- A level further maths modules (edexcel) »
- University Course Options »
Comments
No comments have yet been made